Strategy Byte - Week 13 : Country Analysis - GDP

Table of Contents
- Recap
- Save Vs. Spend - Future Vs. Present
- BEA Statement Analysis
- GDP Component Breakup
- Linkage to Strategy
Recap
Last week we explored a country's resources with source & usage in the context of GDP or Gross Domestic Product. On the source side, a nation procures it's resources from within itself (GDP) & from other nations (Imports). On the usage side, a nation uses it's resources for
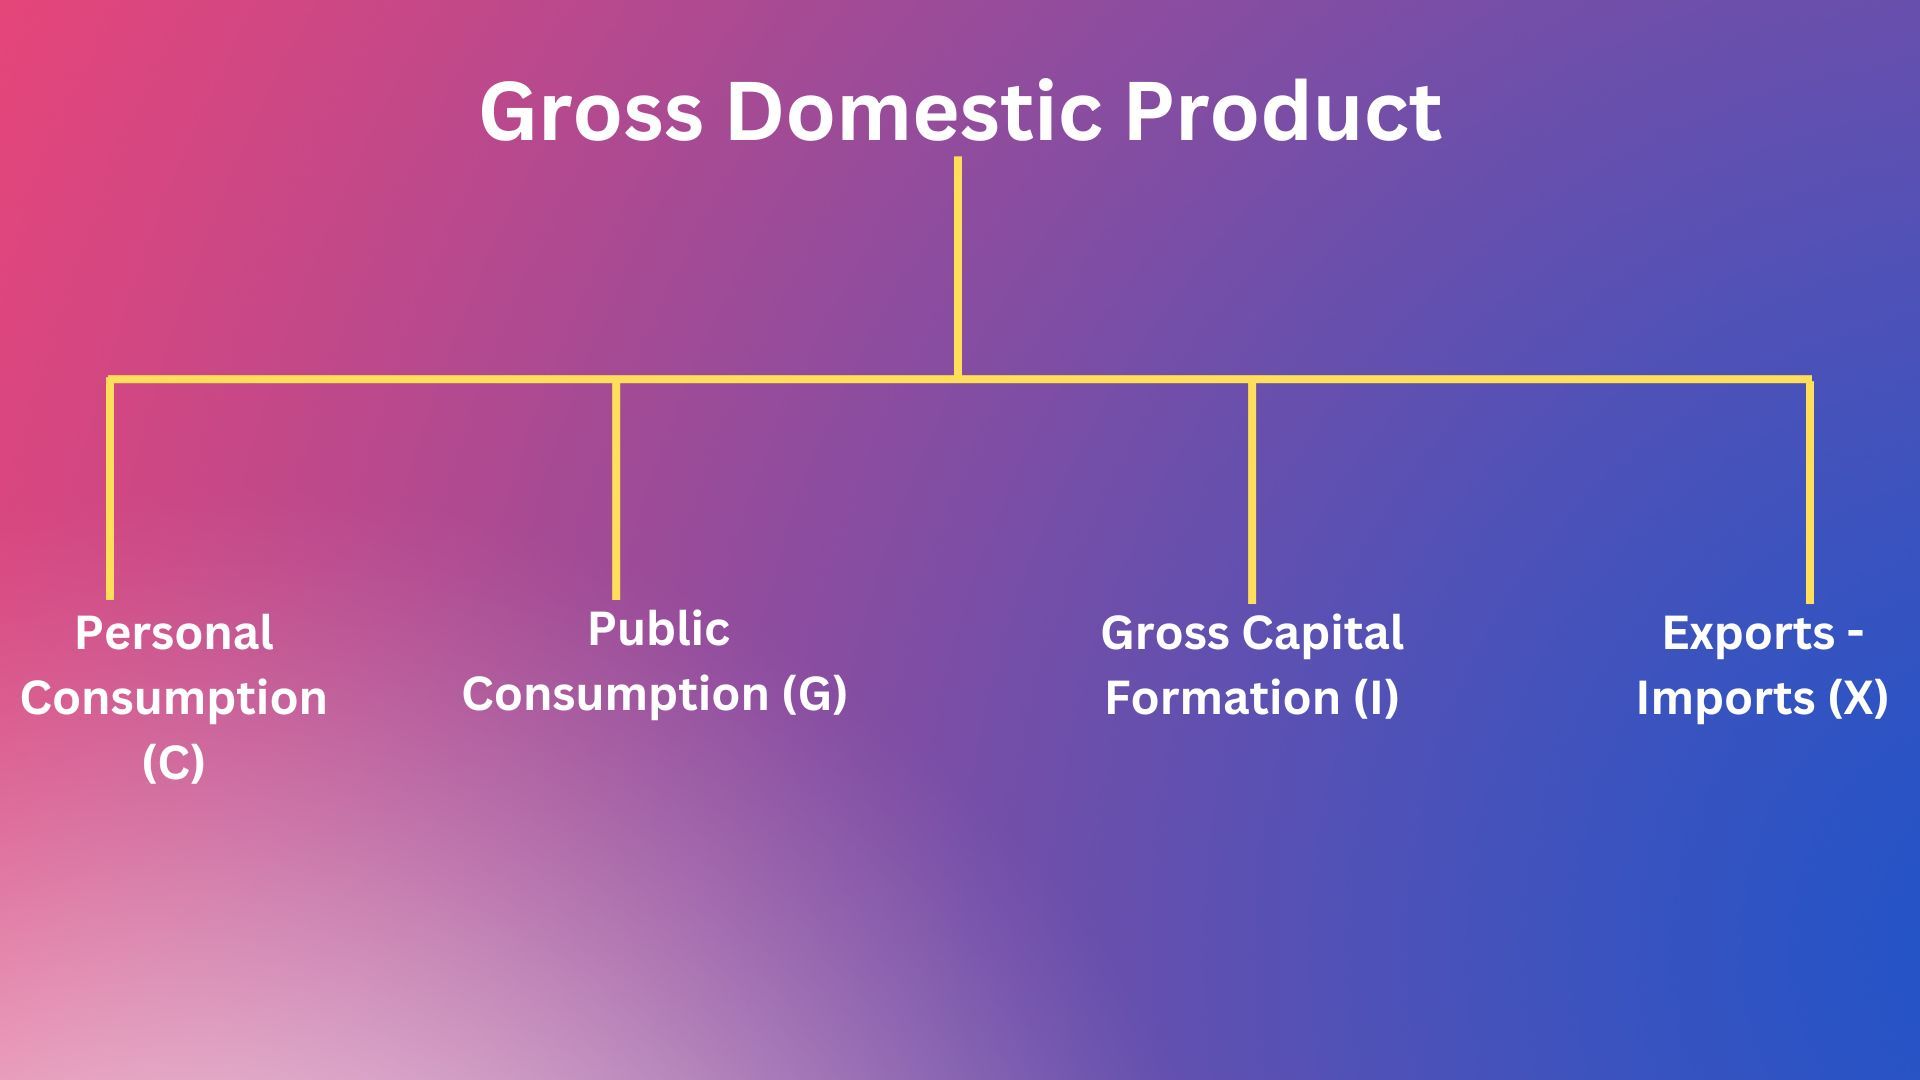
- Personal Consumption (C)
- Public Consumption or Government Spending (G)
- Gross Investment or Gross Capital formation (I)
- Net Exports = Exports - Imports (X)
Visualizing the above:
We then ended with the below extract from US Bureau of Economic Analysis (BEA):
| Q2 2023 (2nd) | +2.1% |
| Q1 2023 (3rd) | +2.0% |
Real gross domestic product (GDP) increased at an annual rate of 2.1 percent in the second quarter of 2023, according to the “second” estimate. In the first quarter, real GDP increased 2.0 percent. The increase in the second quarter primarily reflected increases in consumer spending and business investment that were partly offset by a decrease in exports. Imports, which are a subtraction in the calculation of GDP, decreased.
Let us analyze the above statement in more detail. But, before we move forward, let us start with a single family

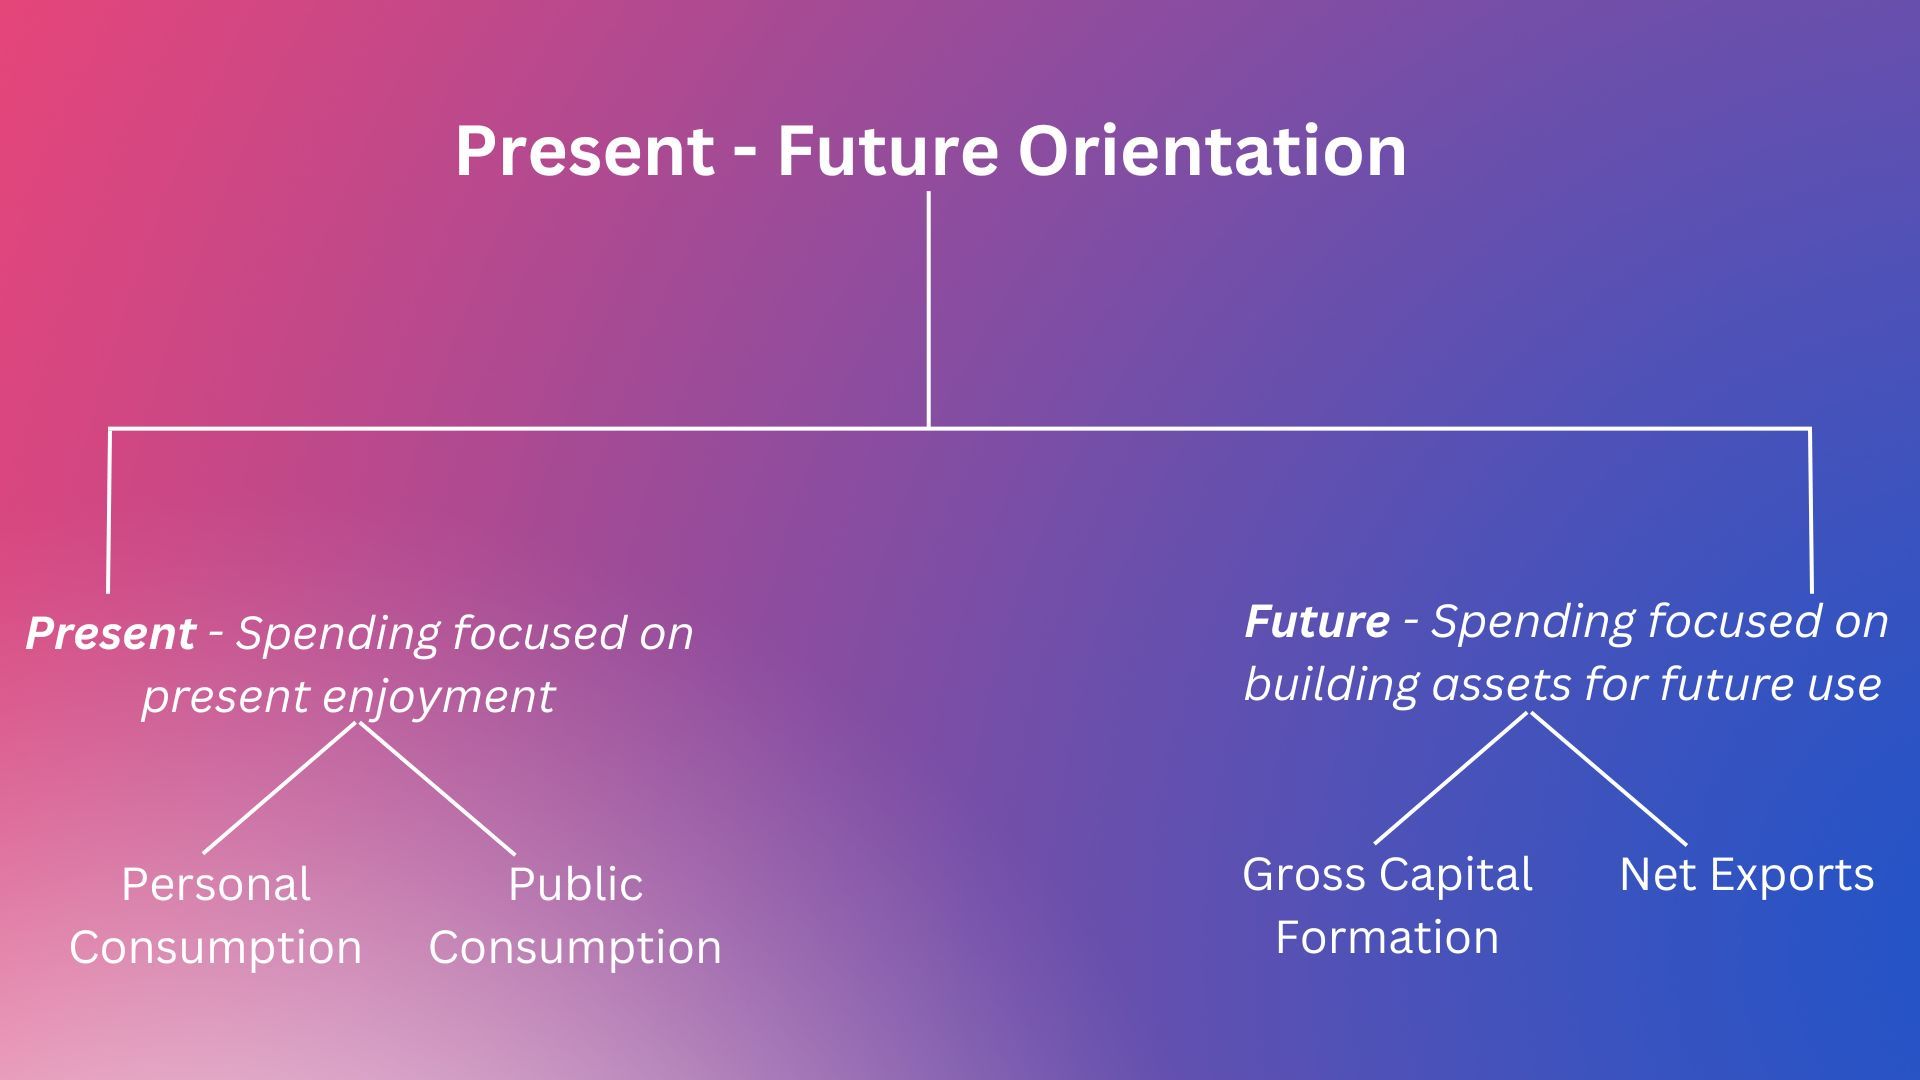
Save Vs. Spend - Future vs. Present
Every month, depending on our nature & predisposition, we either
- Save more to invest or buy some asset which will make our future more productive, secure & sustainable.
- Spend more which makes us focused on our present & less on the future.
If we spend money on a car or any other productive asset like a laptop, we are increasing our capacity to earn more or be more productive by saving time or effort.


If the proportion of savings compared to spending is high each month, it means we are more future oriented as we are sacrificing current consumption for future enjoyment.
Conversely, if our consumable expenses (say, for a yummy pizza!!) is higher compared to savings, it means we are more present oriented & focused on the present ignoring the future.

Let us expand the above framework to a country which consists of households, individuals & businesses.
The question to ask is - How is a country spending it's resources? Is it for
- Present Consumption or
- Future Investment
Let us now analyze the US BEA (Bureau of Economic Analysis) statement.
BEA Statement Analysis
Salient points from the above BEA statement:
- GDP increased at an annual rate of 2.1% in second quarter of 2023.
- In the first quarter, real GDP increased 2.0 percent.
- This increase was primarily due to increase in consumer spending (C) & Business Investment (I)
When the analysis says GDP increased from the past, it means that country is using resources more than what it used to in the past. Now, these additional resources could be produced from within or imported. We will get into that part later but for now, focusing only on the increase in usage, the increase was primarily due to increase in consumer spending (C) & Business Investment (I).
The proportion of spending to investments / savings is important to see whether a country is consuming more or saving more.
How do we know this proportion?
For this, we need to know what is the composition of the GDP meaning what % of GDP comprises of
- Personal Consumption (C),
- Public Consumption (G),
- Gross Investments (I) or
- Net Exports (X).
GDP Component Breakup
Let us look at the below breakup of US GDP :
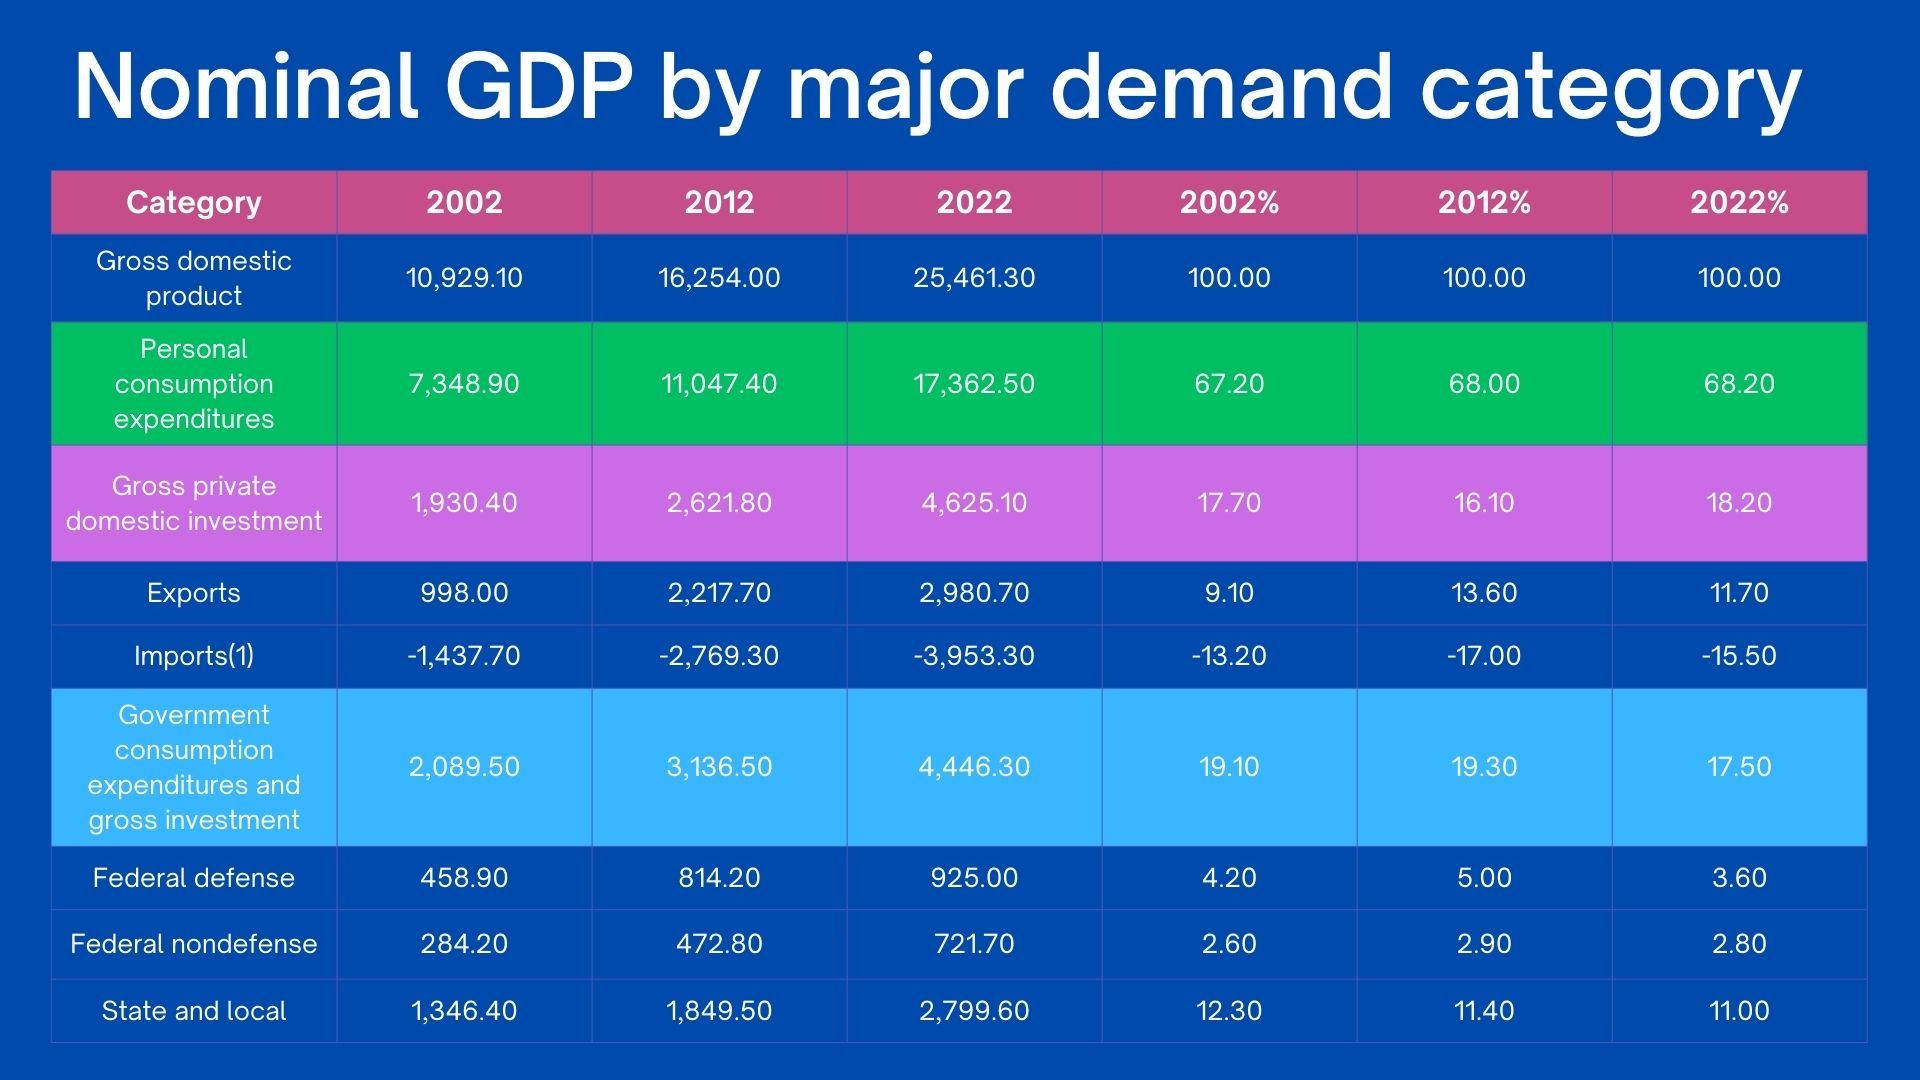
Source : US Bureau of Labor Statistics
(1) Imports are subtracted from the other components of GDP because they are not produced in the United States
The above table gives the breakdown of US GDP for 2002, 2012 & 2022 along with % proportion of each component.
We can see from the above that the highest proportion of GDP is consumption by Individuals & households under "Personal Consumption Expenditures" at around 68.2% in 2022 followed by "Government Consumption Expenditures" at around 17.5% of GDP both totaling to around 85.7%.
Next is Business investment under "Gross Private Domestic Investment" which takes around 18.2% in 2022.
US is a net importer as can be seen from the table as imports are greater than exports & Net Exports is actually negative as of 2022.
So, the proportion of Personal Consumption + Government Expenditure takes up around 85.7% of GDP (68.2% + 17.5%). This makes the US a present oriented economy where consumption is majority proportion of the GDP.
Compare the above to other major economies breakup of GDP (Period 2017 estimated as per source website):
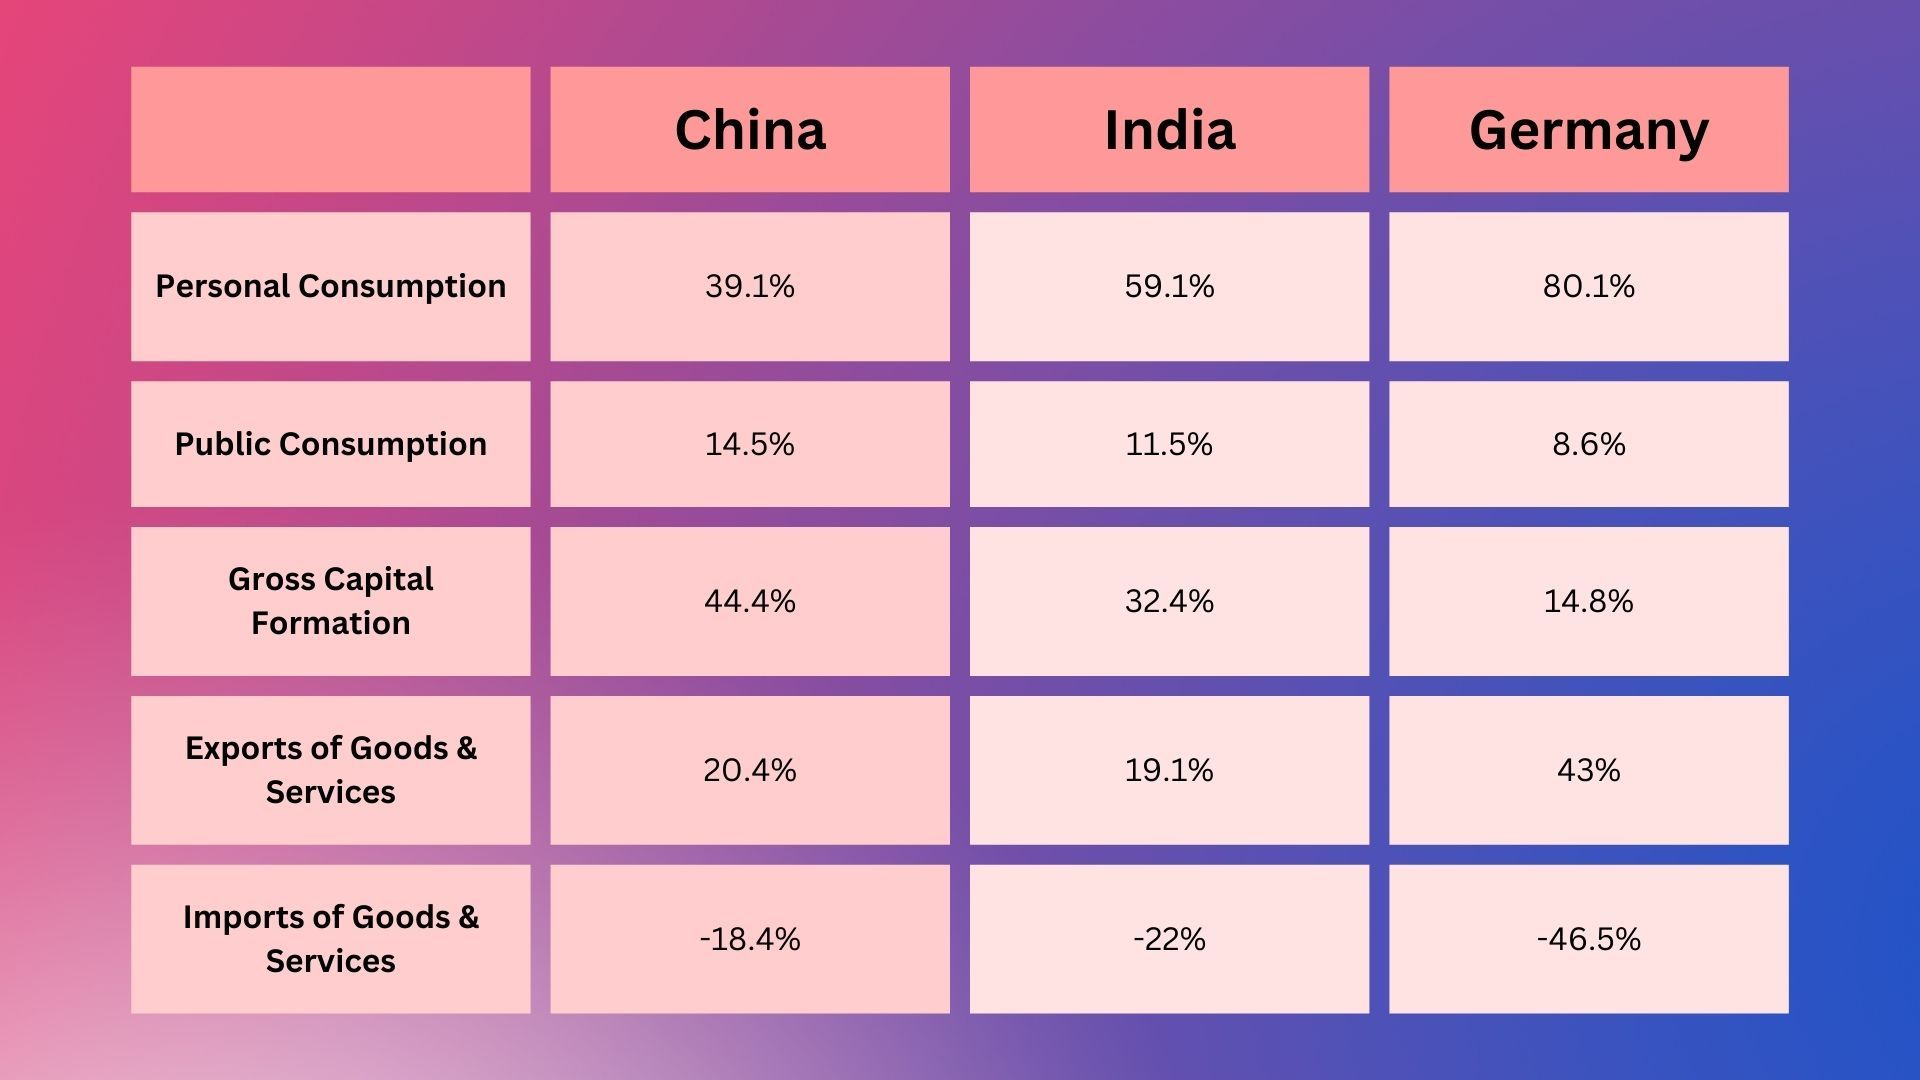
Source : CIA World Fact-book
We can see that for the above period :
- China & India have lower consumption driven economy compared to US & even Germany
- China invested most in infrastructure & other productive use followed by India
- China is a net exporter compared to Germany, US & India.
- Gross exports for all three economies comprise a high % compared to US.
Let us take a step back to see some data on GDP for some major economies & their trending from 2018 to 2022.
GDP Country Analysis
Let us now look at top 10 countries by GDP & their trending over the last 5 years.
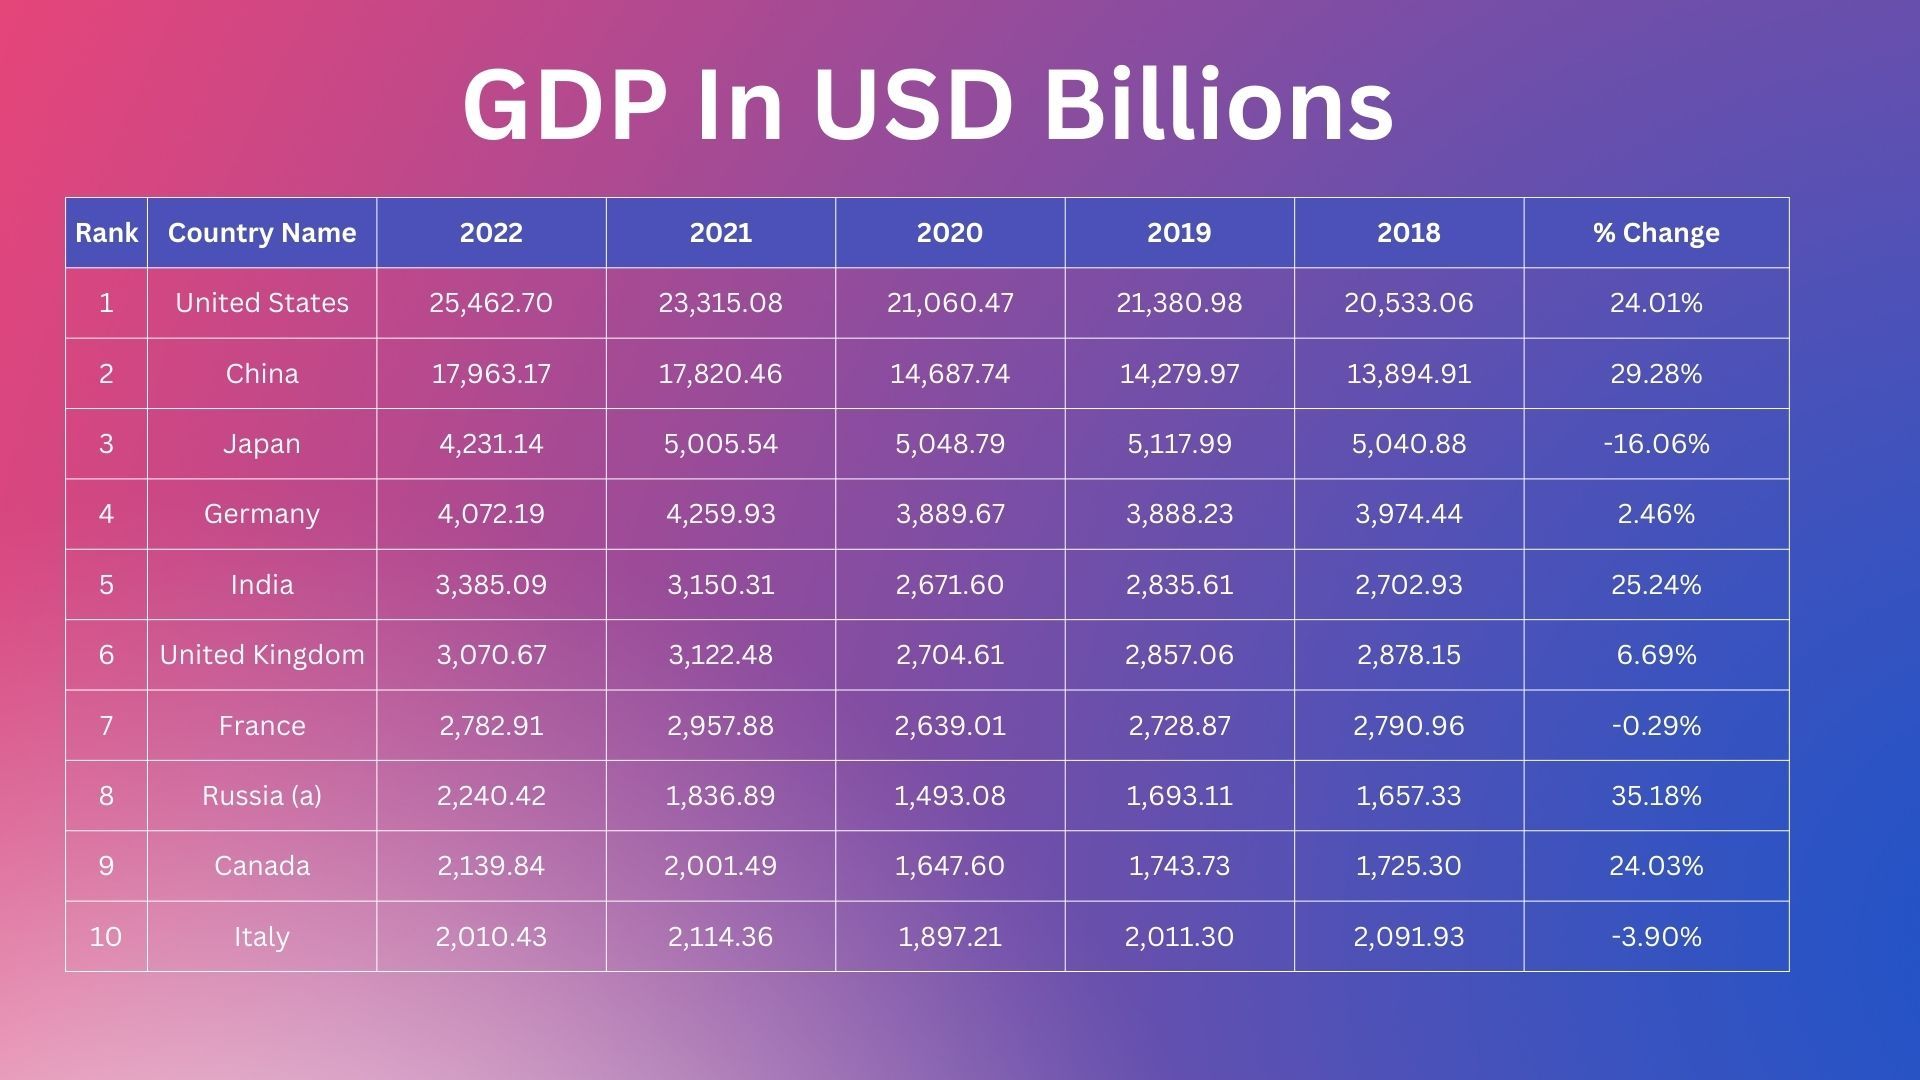
Source : World Development Indicators database, World Bank, 1 July 2023
(a) Based on data from official statistics of Ukraine and Russian Federation as well as the United Nations
We can see that GDP increased for some countries which means these economies were expanding signalling future prospects for companies or industries intending to move to these countries.
But just looking at GDP increases without looking at the components gives an incomplete picture as the underlying drivers of an economy need to be understood.
Linkage to Strategy
Why is all this relevant in strategy? Let us visualize the above discussion points as below :
When a company analyzes a market or creates a forecast for it's goods or services before it opens up or expands business in either it's host country or in another country, the below questions become pertinent (not an exhaustive list) .
Local Market
- How is the market for the company's products or services?
- Do people have money to spend making demand strong for goods & services?
- Availability of credit?
- Are retail sales strengthening or weakening?
- What is the Government policy towards infrastructure development & related spending?
- Predictions of Industry & Trade Associations?
- Are governments spending more or are they slashing budgets? How will it impact us?
- Will taxes rise or fall?
- Do businesses expect demand to rise requiring new investments like factories or weak, meaning no new investments by businesses?
- What does the profitability trend look like? Weak or strong
International Market
- What are the policies of the Government towards international trade, exports & imports?
- How is the exchange rate moving relative to other currencies?
- Is the country's global competitive advantage growing stronger or weaker?
All the above questions are related to one or more of the components discussed above. Next question to analyze -
Which GDP component drives a country's growth or decline?