Finance Byte - Week 11 Product Mix

Table of Contents
- Recap
- Product Mix Contribution Analysis
- Loss Leaders
- From Cafe to Apple
Recap
During Week 10 of Finance Bytes, we discussed contribution. We started with cost behavior by dividing costs into :
- Variable Costs
- Fixed Costs
Variable costs are costs that change in proportion to a company's production or sales volume - they rise as production or sales increase & falls as production or sales falls.
Fixed Costs are costs that don't normally change with an increase or decrease in the number of goods produced or sold by the business.
Then we defined contribution through the below equation :
Contribution = Selling Price - Variable Costs
And defined it as below:
When you make a product or deliver a service and deduct the variable cost of delivering that product or service, the leftover revenue is called contribution.
We plotted the monthly sales of Jack for one product - Matcha Latte against the variable costs as below:
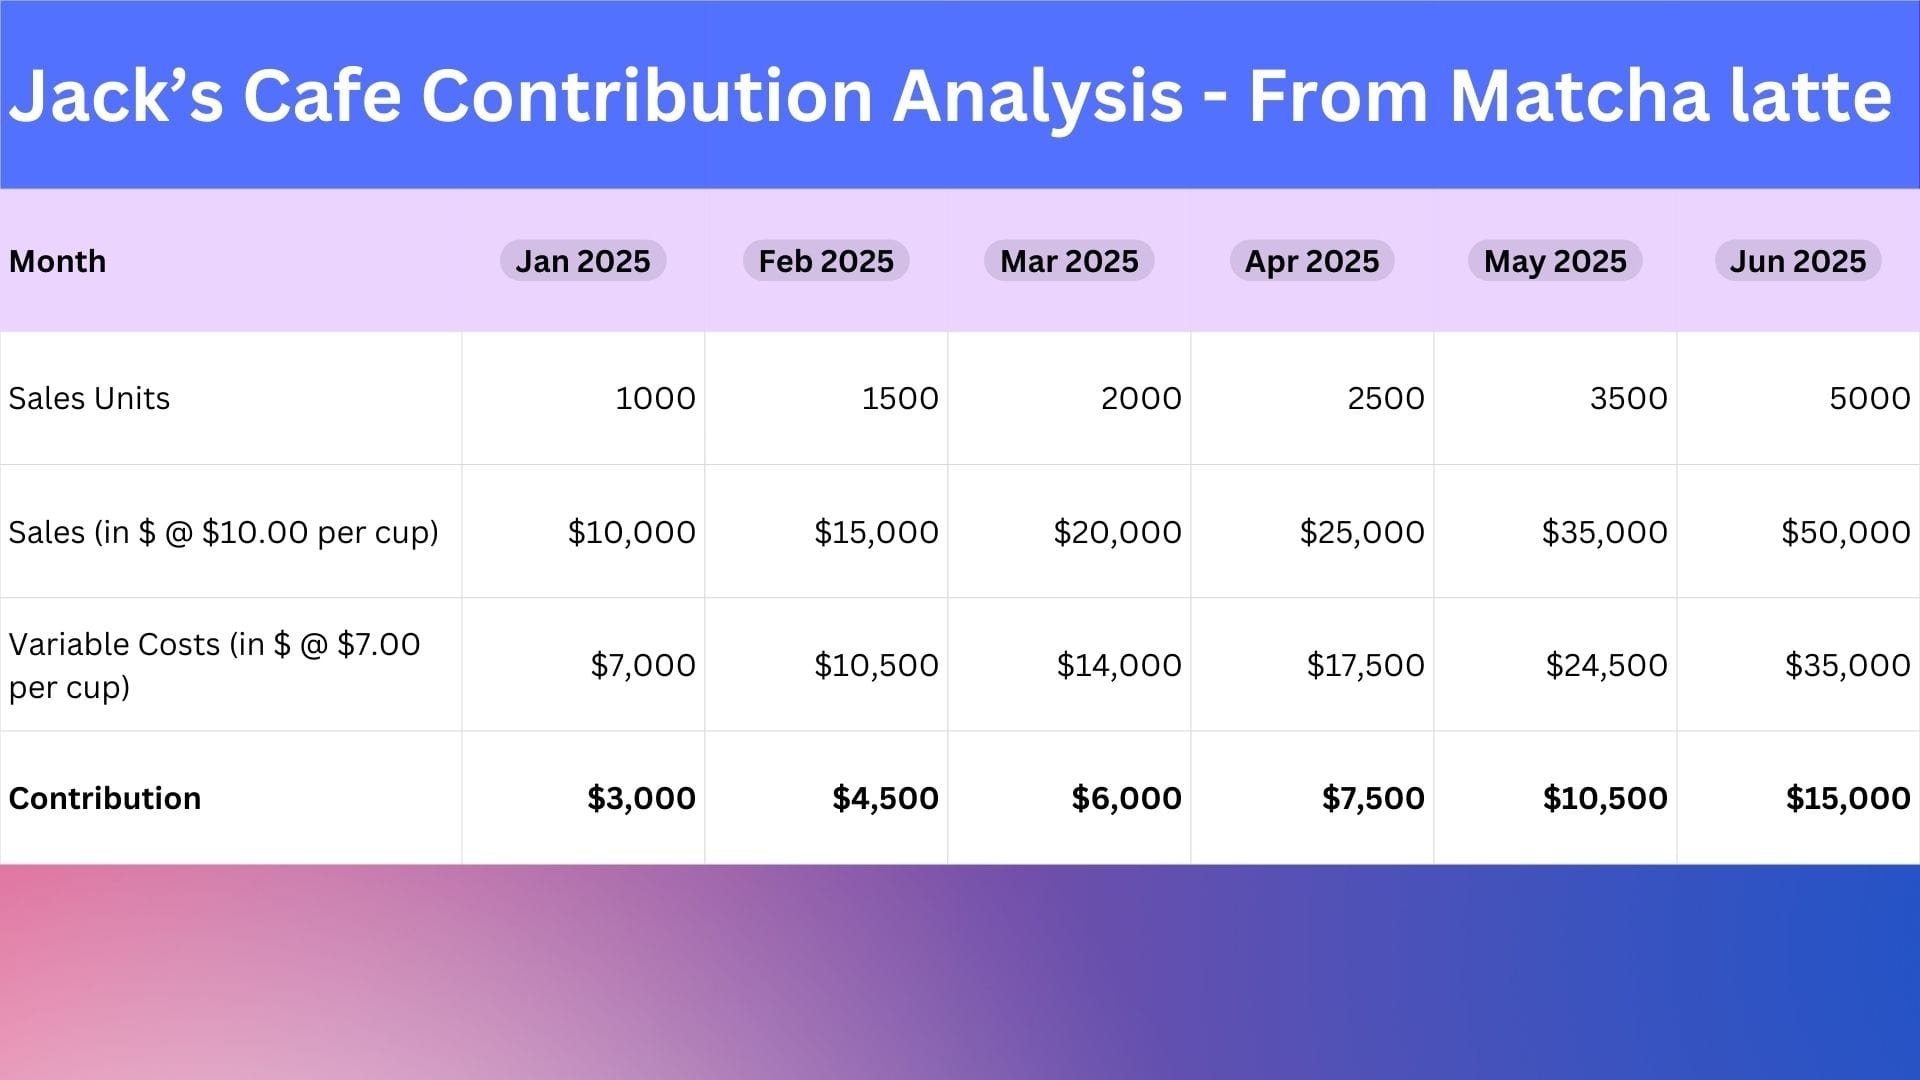
We can see that the more cups he sells, the higher is his contribution from sales of Matcha Latte.
We also defined Contribution Margin as contribution expressed as a % of Revenue.
Products with higher contribution margin would cover fixed costs & generate higher profitability.
But how does this help Jack to
- Undertake action to increase his cafe profitability &
- When he sells multiple products, how does he know which product is most profitable & which is least?
This week, we go from one product contribution analysis to multi product contribution analysis. For that, we need to understand Product Mix Contribution Analysis
Product Mix Contribution Analysis

Jack does not only sell Matcha Latte. He has other latte mixes, hot coffee, tea & snacks with other eatables.
We know the contribution margin from Matcha Latte (from Week 10) is 30%.
If we do similar contribution analysis for each of the other products, Jack can arrive at a contribution margin for each of them.
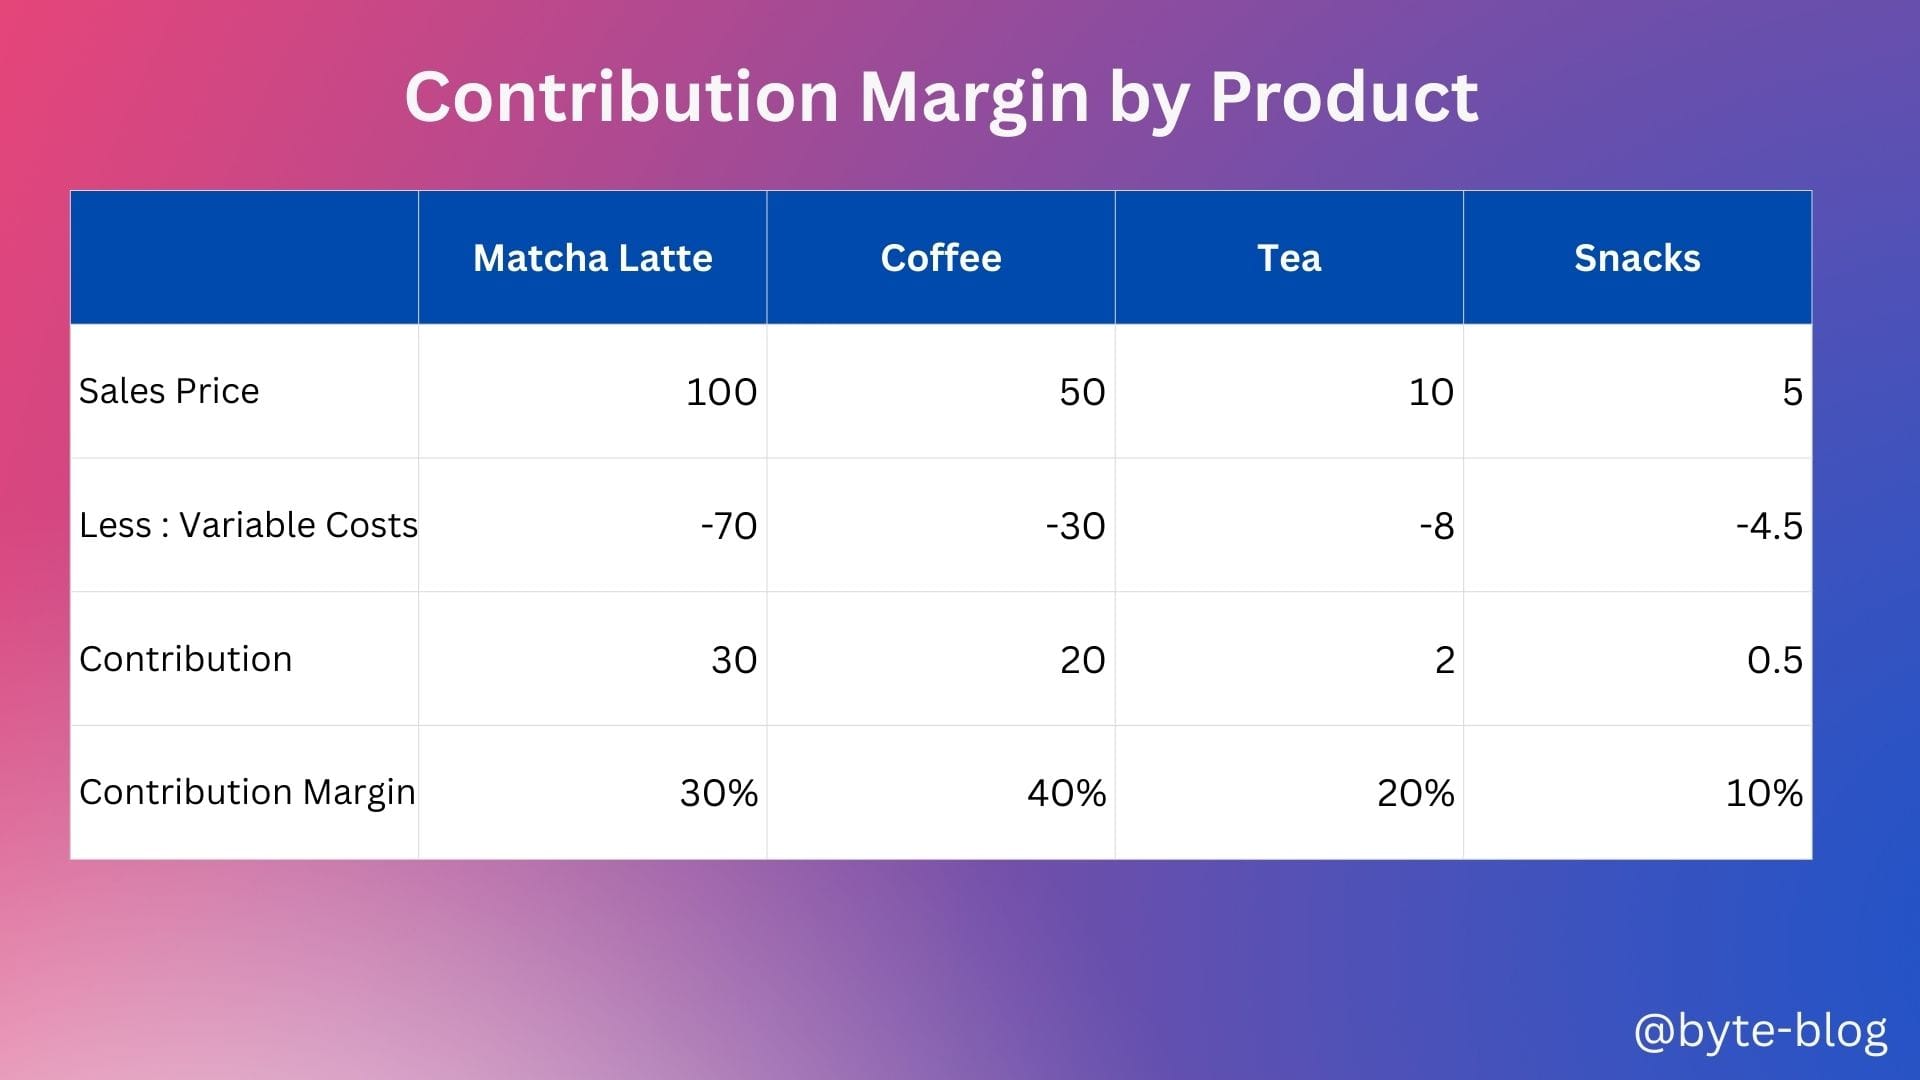
Let us check all of them against each other with made up numbers:
Why is such analysis important? We have covered one part of costs which is variable costs in our contribution analysis. But what about Fixed costs? That needs to be covered too, otherwise the product ends up making a loss (When the sales revenue from the product is less than the total costs - variable + fixed to make & sell that product).
Contribution Margin indicates how much each product contributes to covering the fixed costs & generates profit. In our analysis above, we can see that coffee contributes 40% margin towards covering fixed costs allocated to it while snacks contributes only 10%. What does this tell us?
This tell us that coffee & matcha latte are high performing in terms of covering fixed costs & generating profits while tea & snacks are less performing.
So, to increase his overall profitability, Jack needs to sell more Matcha Latte & coffee and less tea & snacks. If sales volume from Matcha Latte & cofee increases, that will contribute to increasing his profit margins as products which cover the fixed costs by a higher margin will increase.

Does this mean Jack stop giving tea & snacks to customers? It's not that easy & straightforward decision. Customers come in not only to drink Matcha Latte & coffee. They might need snacks with their drinks & maybe they want to drink tea.
So, Jack has to manage his product mix in a way that his profit potential is maximized in line with customer needs & market requirements. That is the key here.
Loss Leaders
It's not blindly seeing the numbers & dropping products which are less profitable. He has to analyze the customer purchase habits & decide accordingly. It may mean that he has to keep unprofitable products in his product mix if customers love those products. If customers love his snacks, he has to keep it in his product mix to sell them along with his other products eventhough they are less profitable.
This strategy of including a product which sells at a loss along with other profitable products is called Loss Leader. It is defined as :
A loss leader strategy involves selling a product or service at a price that is not profitable but is sold to attract new customers or to sell additional products and services to those customers. (Source : here)
There are many examples of loss leader strategies like Gilette selling their razor units at a low price knowing that customers will buy replacement blades which will give them consistent future revenue at a higher margin.
It also means Jack has to manage his costs in a way that he extracts value from each product to the maximum extent. For e.g., he might be earning low margin on snacks as he is outsourcing it from another vendor. He can either negotiate with the vendor for lower rates which would increase his contribution margin assuming he maintains the same sales price or go with another vendor who will provide him with competitive pricing on the snacks.

From Cafe To Apple
Let us move from Jack's Cafe to Apple.

Apple does not disclose Contribution by Product but they do disclose revenue by product. The Internal FP & A team might be doing a contribution analysis as it is not enough to do revenue by product but which of those products cover their fixed costs & adds to the overall profitability of Apple. The below visualization summarizes the product revenue as % of total revenue.
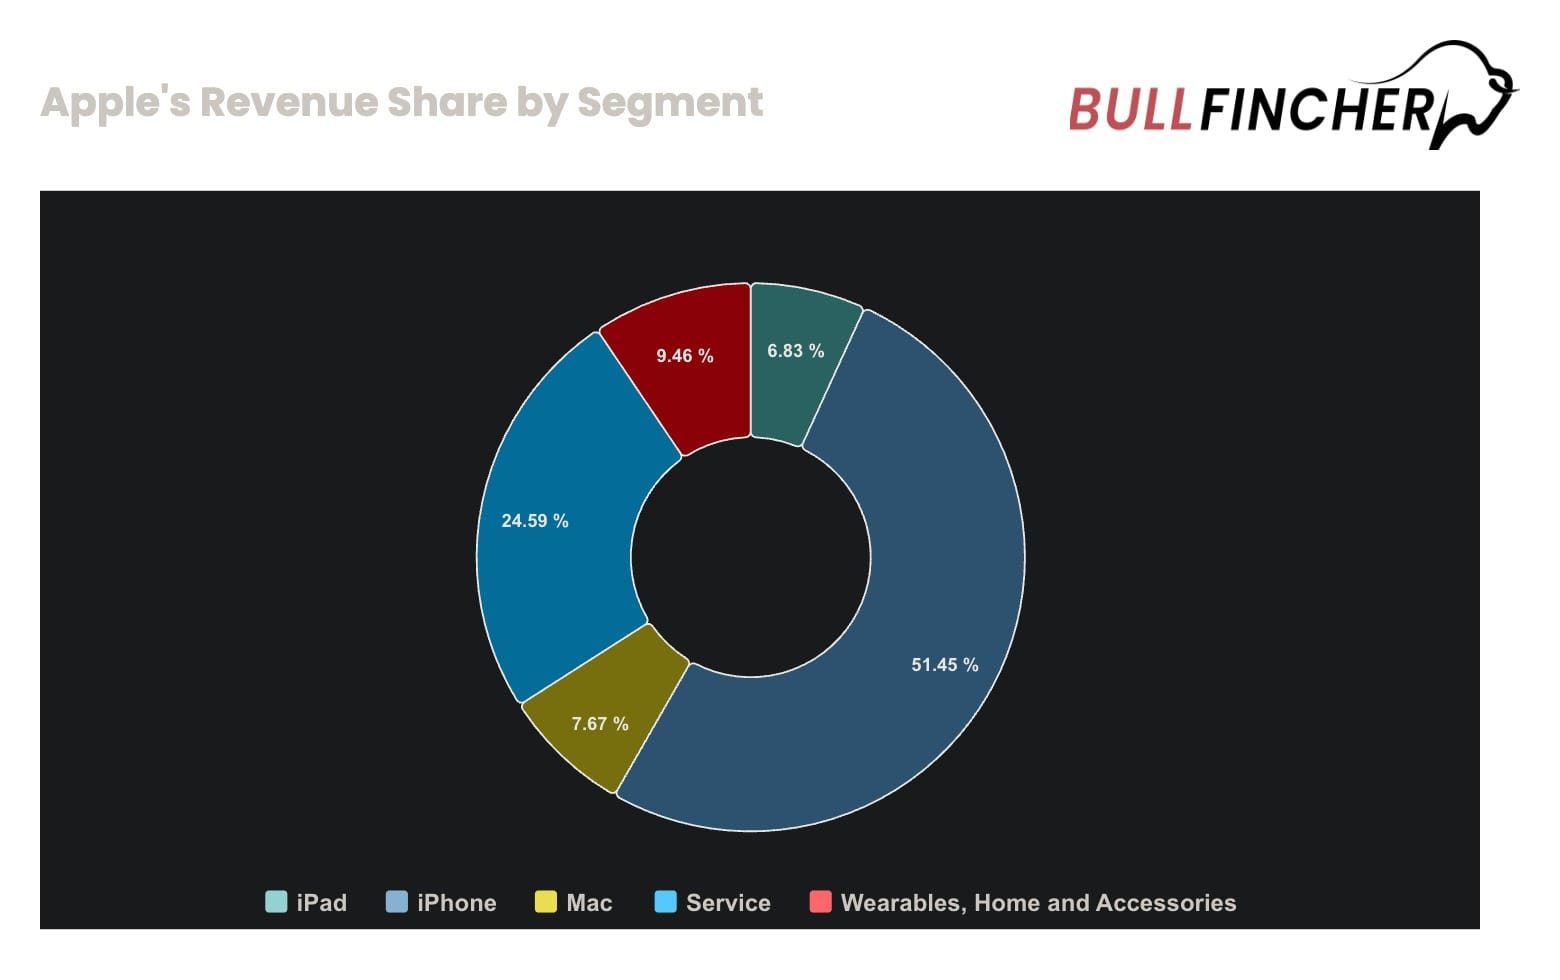
In fiscal year 2024, Apple's revenue by segment is as follows:
- iPad generated $26.69 B in revenue, representing 6.83% of its total revenue.
- iPhone generated $201.18 B in revenue, representing 51.45% of its total revenue.
- Mac generated $29.98 B in revenue, representing 7.67% of its total revenue.
- Service generated $96.17 B in revenue, representing 24.59% of its total revenue.
- Wearables, Home and Accessories generated $37.01 B in revenue, representing 9.46% of its total revenue.
The biggest segment for Apple is the iPhone, which represents 51.45% of its total revenue.
The smallest segment for Apple is the iPad, which represents 6.83% of its total revenue.
(Source : here)
The Iphone remains the cornerstone of Apple's revenue at 51.45% with services coming a distant second with 24.59%. Services segment consists of the App Store, ITunes, AppleCare fees, Apple Pay & other digital services. The contribution of Services in 2023 was 22.23% & thus represents a significant increase from 2023. It shows Apple's focus to increase monetization from services & diversify away from initial hardware purchases & create recurring revenue to complement it's hardware. (E.g., Apple Music, Apple TV subscriptions on purchase of any apple product).
We have to note that the efficiency of contribution analysis depends on how robust the system is to capture & allocate costs to individual products. Direct costs can be captured & allocated to individual products like component & labor costs for Iphone, Ipad etc. Allocation of indirect costs can be tricky & involves assumptions which must be robust & revisited periodically depending on circumstances.
Another complication is that costs don't stay the same over a period of time. Variable costs may change reducing the margin for some products & requires constant revision & analysis. Fixed costs change in line with step up in production or sales which we will get into later.