Strategy Byte - Week 12 : GDP - Resources & Usage

Recap
Last week we used the analogy of a picnic spot to describe how we pick the most optimal environment for having fun with our friends or family. Similarly, a company should analyze it's external environment to ensure it maintains it's competitive advantage & sustainable profits.
We started with "country" as the picnic spot with the below two questions :
- What is the current state of a country's economy & it's inherent risk?
- Based on the above analysis, what is the most likely short term or long term scenario?
We started with GDP or Gross Domestic Product which is defined as
- The monetary value of final goods & services - i.e., those that are bought by the final user &
- produced in a country in a given period of time (say, a quarter or year)
GDP is important because it gives information about
- The size of the economy &
- How an economy is performing
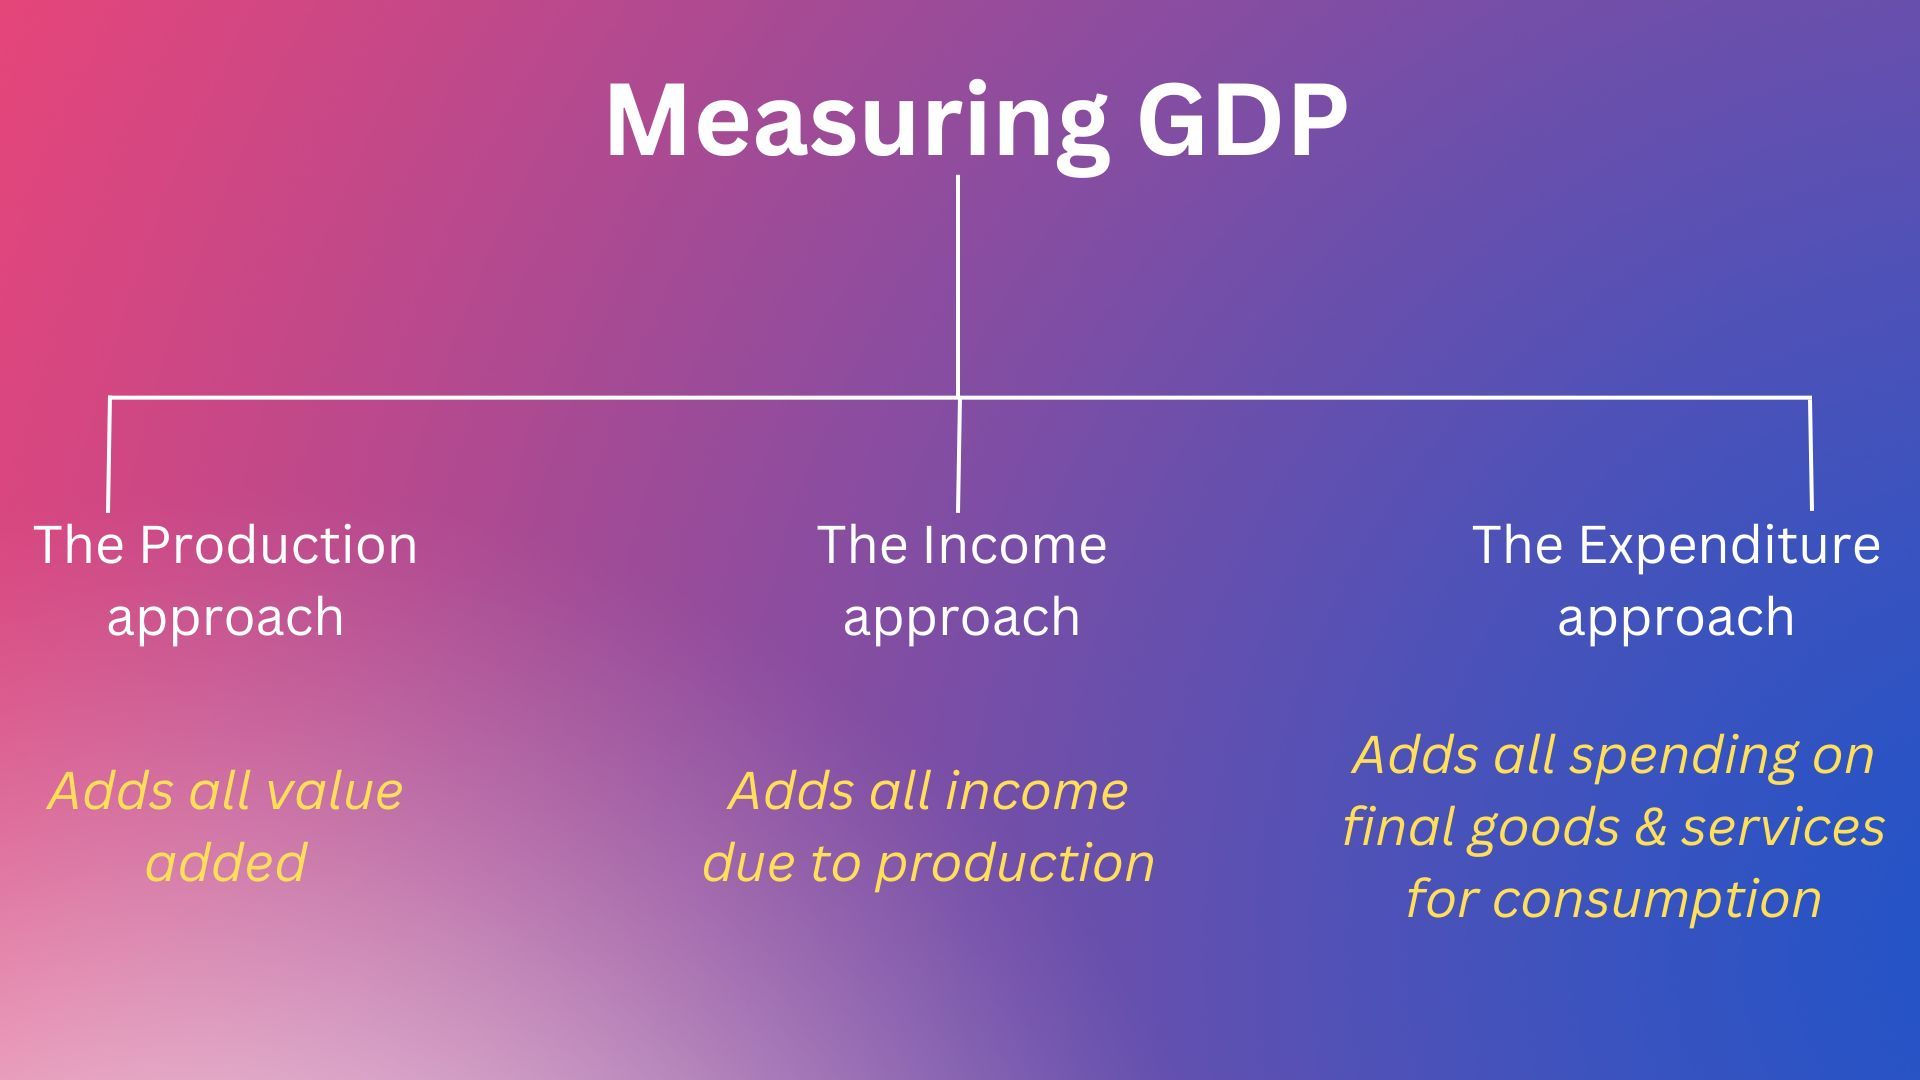
There are three ways of measuring GDP as below :

From where does a nation procures its resources to produce goods & services ?
Let us move on to the usage or consumption of these goods & services.
Resource Usage
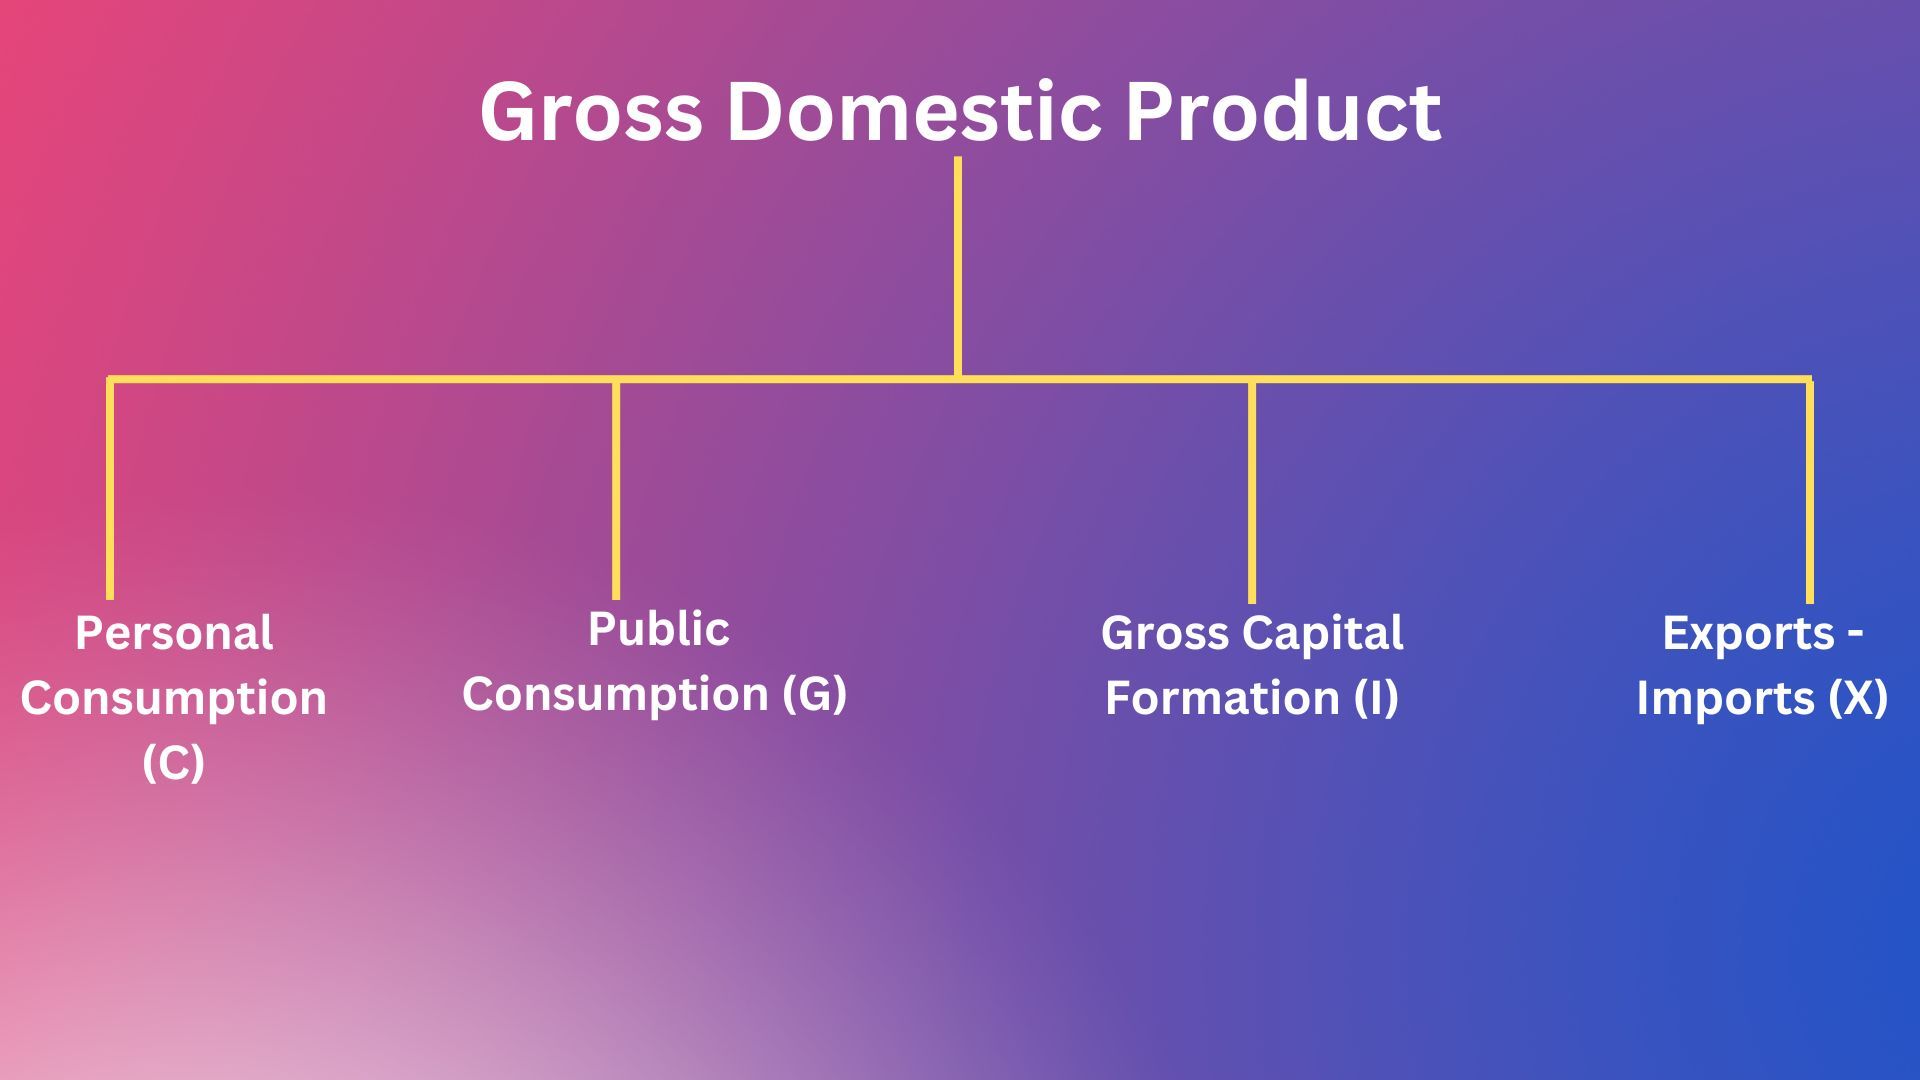
Now, how are these goods & services used or consumed? Consumption can be classified by who or what uses these goods & services as below :
- Personal Consumption (C)
- Public Consumption or Government Spending (G)
- Gross Investment or Gross Capital Formation (I)
- Exports (X)
Visualizing the above :

Let us deep dive into each of the above in simple terms :

Personal Consumption
What individual & families purchase or spend for their daily existence. E.g., groceries, durable goods, non-durable goods, healthcare, education etc.
Public Consumption
What governments purchase to supply public goods & services such as education, defense, public services etc.
Gross Investment
What businesses or companies buy in order to expand their productive capacity to produce more goods & services.
Exports
When a nation sells it's goods or services to other nations.
The above are straightforward & require no further explanation. In simple terms, a nation produces or imports resources necessary for producing goods & services which in turn is used by various parties to keep the nation moving forward.
We will not go deep into the macro-economic aspect but just to get the point across, we will go through a simple logic outlined below to arrive at GDP & then see why is it important in the context of strategy.
So, the equation for Resource Usage will be :
Law of Resource Conservation
The law states that the sources of resources is equal to their usage which means
Recapping our Resource source formula,
Hence,
So, GDP means
This is important. So visualizing the above,:

What does this all mean? Why is this important to strategy?
Strategy is not a one time exercise, but an ongoing process to identify opportunities, risks & sustain competitive advantage etc. A country analysis is very important
- To ensure the environment helps to maintain or increase competitive advantage in one's own country or
- To ensure proper conditions exist in another country for the business to thrive & maintain sustained competitive advantage in that environment.
- For a business in multiple geographies to ensure proper strategic considerations exist to continue, expand or discontinue business in those countries.
To analyze a company's financial position, we use the balance sheet, income statement & cash flow statement along with notes to financials. Similarly, it is important to read a country's GDP data as if it was the income statement of that country. We can draw strategic conclusions about the country's market size, savings, investment growth orientation & future prospects which are useful for guiding strategic decisions.
We invest in companies whose future prospects are bright & where we can earn sustained returns either through dividends or capital appreciation. Similarly, countries with good future prospects of development create environments where businesses can thrive & maintain their competitive advantage resulting in inflow of investments into that country.
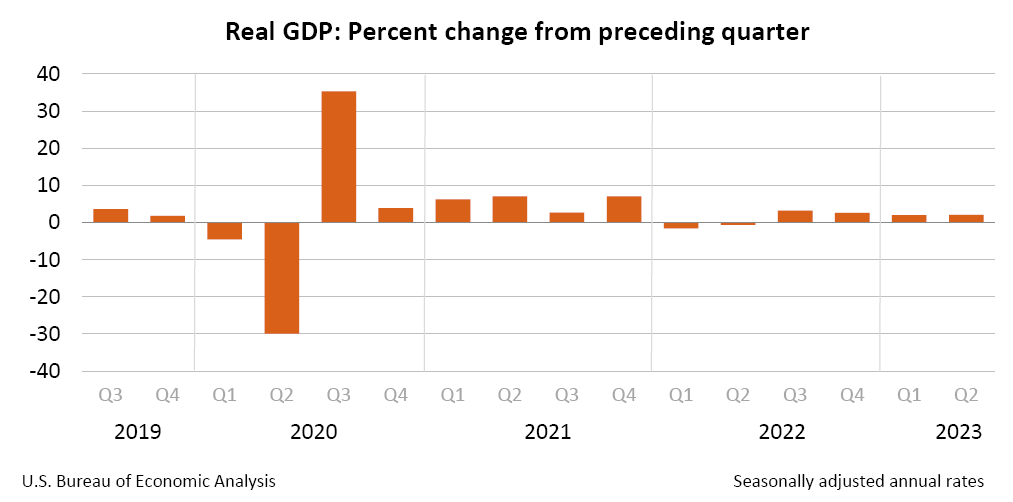
How can we use GDP data for such analysis? Let us start with the below extract from the US Bureau of Economic Analysis:
Q2 2023 (2nd)
|
+2.1%
|
|
Q1 2023 (3rd)
|
+2.0%
|
Real gross domestic product (GDP) increased at an annual rate of 2.1 percent in the second quarter of 2023, according to the “second” estimate. In the first quarter, real GDP increased 2.0 percent. The increase in the second quarter primarily reflected increases in consumer spending and business investment that were partly offset by a decrease in exports. Imports, which are a subtraction in the calculation of GDP, decreased.

Let us analyze the above with more data from other countries next week!!