Strategy Byte - Week 25 Yield Curve

Table of Contents
- Recap
- Term Structure / Yield Curve
- Debt Securities
- Bonds
- Yield Curve Relevance
- Economic Outlook
- Market Expectations
- Yield Curve Update 2024
Recap
During week 24, we started with Base Rate (set by the Central Bank or Monetary Authority) & went up to Prime Rate which is
The interest rate that Commercial Banks charge their most creditworthy customers.
The Prime Rate serves as a benchmark for many other loans & is in turn influenced by the base rate set by the Central Bank or Monetary Authority.
Depending on how creditworthy a customer is, banks add a spread called "Risk premium" to take into consideration the default risk of that customer (meaning risk of customer not paying). This spread is higher for high risk customers & products (like credit cards or personal loans).
Banks also add operating margin & profit margin to cover their operating expenses & earn a margin.
Regulatory requirements, competitive environment & market conditions also affect lending rates.
We then ended with Reserve requirements which is the minimum amount that a commercial bank must hold in liquid assets. This is also known as Cash Reserve Ratio.
Before we explore what drives interest rates, let us explore one more important concept affecting interest rates - Term Structure or Yield curve & how it signals the economic outlook.
Term Structure / Yield Curve
The yield curve, also called the term structure is
The relationship between the remaining time-to-maturity of debt securities & the yield on those securities (Source : here)
What does the above mean?
Let us take one step back & understand what is debt securities?
Debt Security
A debt security is a type of financial asset that is created when one party lends money to another (Source : here)
When one party borrows money from another through a debt instrument, there is an element of principal & interest payment involved just like normal lending but unlike normal lending which is to a particular entity or person only, debt instruments can be bought or sold between two parties depending on the conditions under which those instruments are issued.
Bond
Now that we defined debt security, let us understand what is a Bond.
Bonds are debt securities issued by Corporations, Governments or other organizations & sold to investors. (Source : here).
For e.g.,
a. Government Bonds - Bonds issued by Governments to finance their activities.
b. Municipal Bonds - Issued by local municipalities, cities etc to finance their infrastructure such as roads, bridges etc.
c. Corporate Bonds - Bonds issued by companies to raise capital for their activities like expansion or acquisition.
To get a perspective on debt securities & bonds & how they impact an economy, let us understand the size of the Bond market (Source : here)
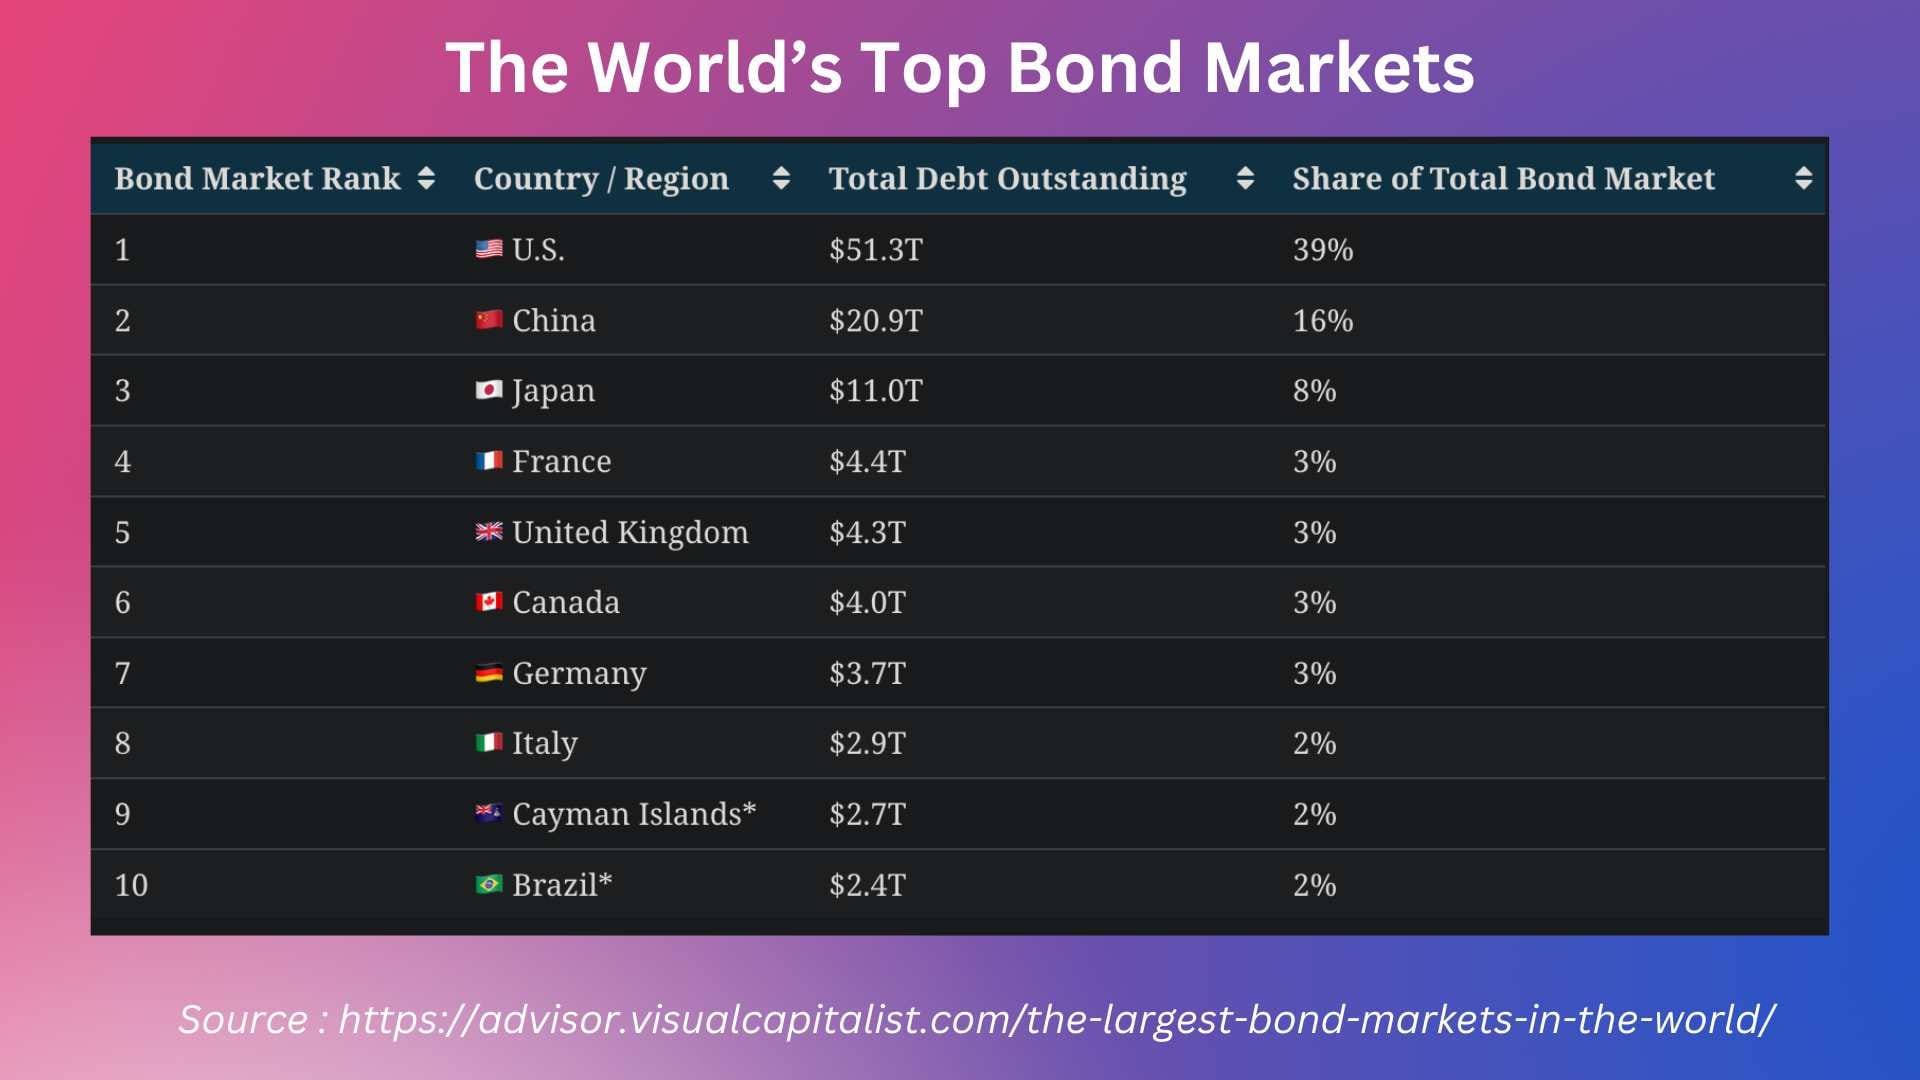
- In 2022, the global bond market totalled USD 133 trillion.
- Valued at over USD 51 trillion, the US has the largest bond market globally
- Government bonds make up the majority of it's debt market, with over USD 26 trillion in securities outstanding.
- China is second, at 16% of the global total.
- As the table shows, Japan has the third biggest debt market. Japan's Central Bank owns a massive share of its government bonds
- In Europe, France is home to the largest bond market at USD 4.4 trillion in total debt, exceeding that of UK.
Along with Central Banks, commercial banks are key players in the Bond market.
So, we can see the enormity of the bond market & it's sheer size which has a major impact on economies around the world.
With that in mind, let us now understand what is Term structure or Yield Curve.
Term Structure / Yield Curve
It is the relationship between the remaining time-to-maturity of debt securities & the yield on those securities.
In simple terms, it just means a line graph showing the relationship between the remaining period for a bond to mature & their yields. The maturities are plotted across the x-axis while the yields are plotted across the y-axis. For e.g.,
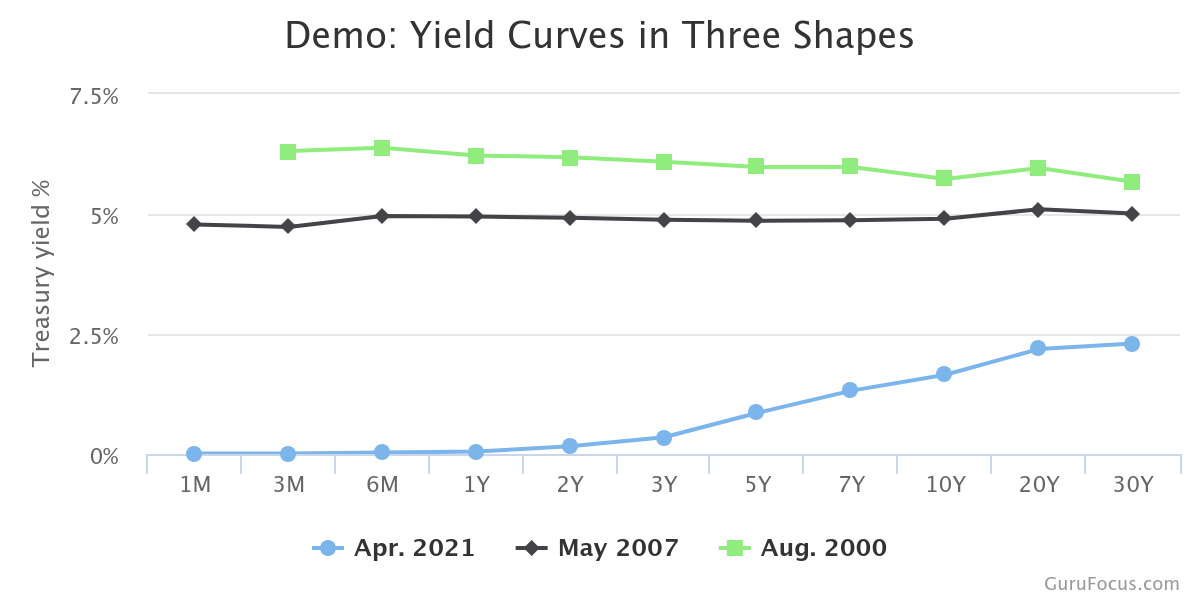
(Source : here)
The above line chart shows the interest rates or yields of bonds across various maturities. Why are there three lines? That is because, the yield is drawn as of three reference periods - as of April 2021, May 2007 & Aug 2000.
If you look closely across the three yield curves, they look different (one goes up, another one is straight & one slopes down). Let us understand why. Data for the above yield curves are provided below:
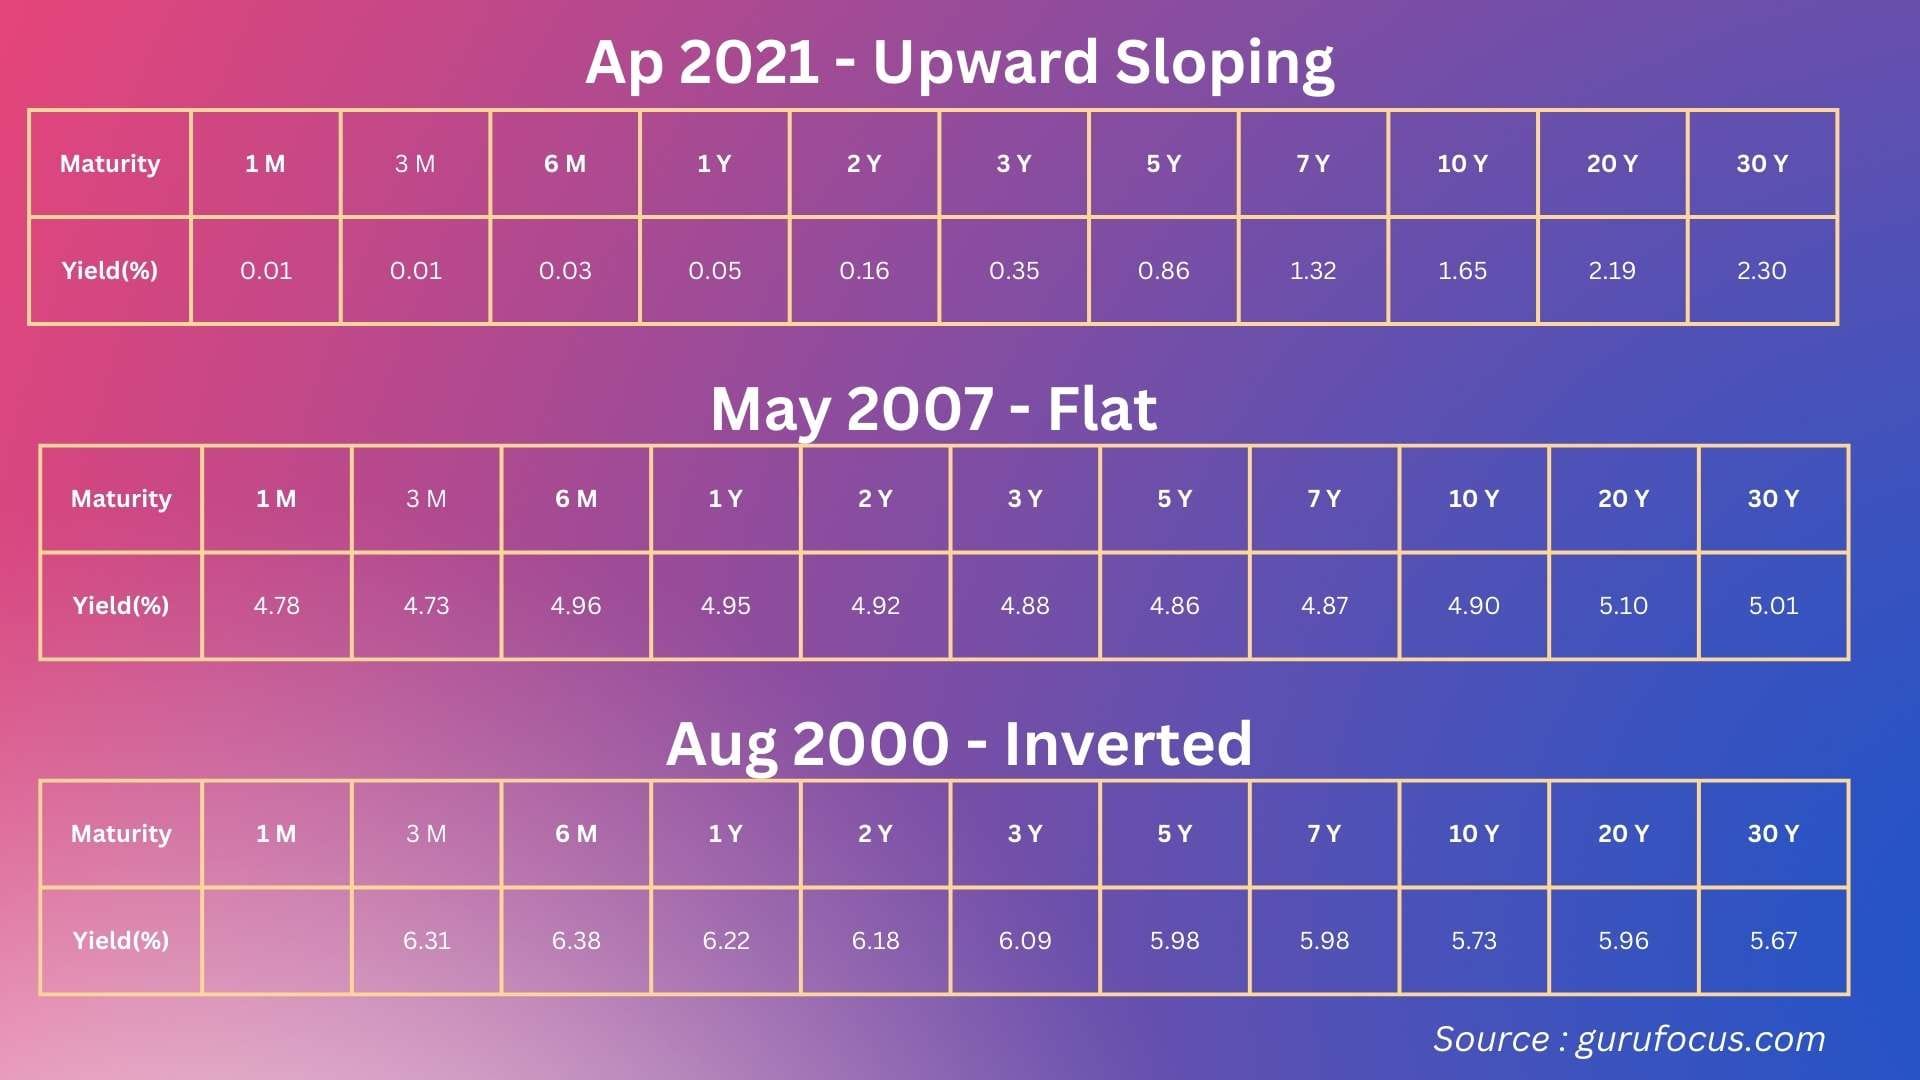
April 2021 Yield Curve
The yield curve as of April 2021 shows a upward sloping curve. This means bonds with shorter maturity have lower yields while bonds with longer maturity have higher yields. This type of yield curve is called a Normal yield Curve or Upward Sloping Yield Curve.
May 2007 Yield Curve
The yield curve as of May 2007 is almost flat. This means that bonds with shorter maturity & longer maturity have almost the same yields. This type of yield curve is called a Flat Yield Curve.
Aug 2000 Yield Curve
The yield curve as of Aug 2000 is an inverted sloping curve. This means bonds with shorter maturity have higher yields while bonds with longer maturity have lower yields. This type of yield curve is called an Inverted Yield Curve.
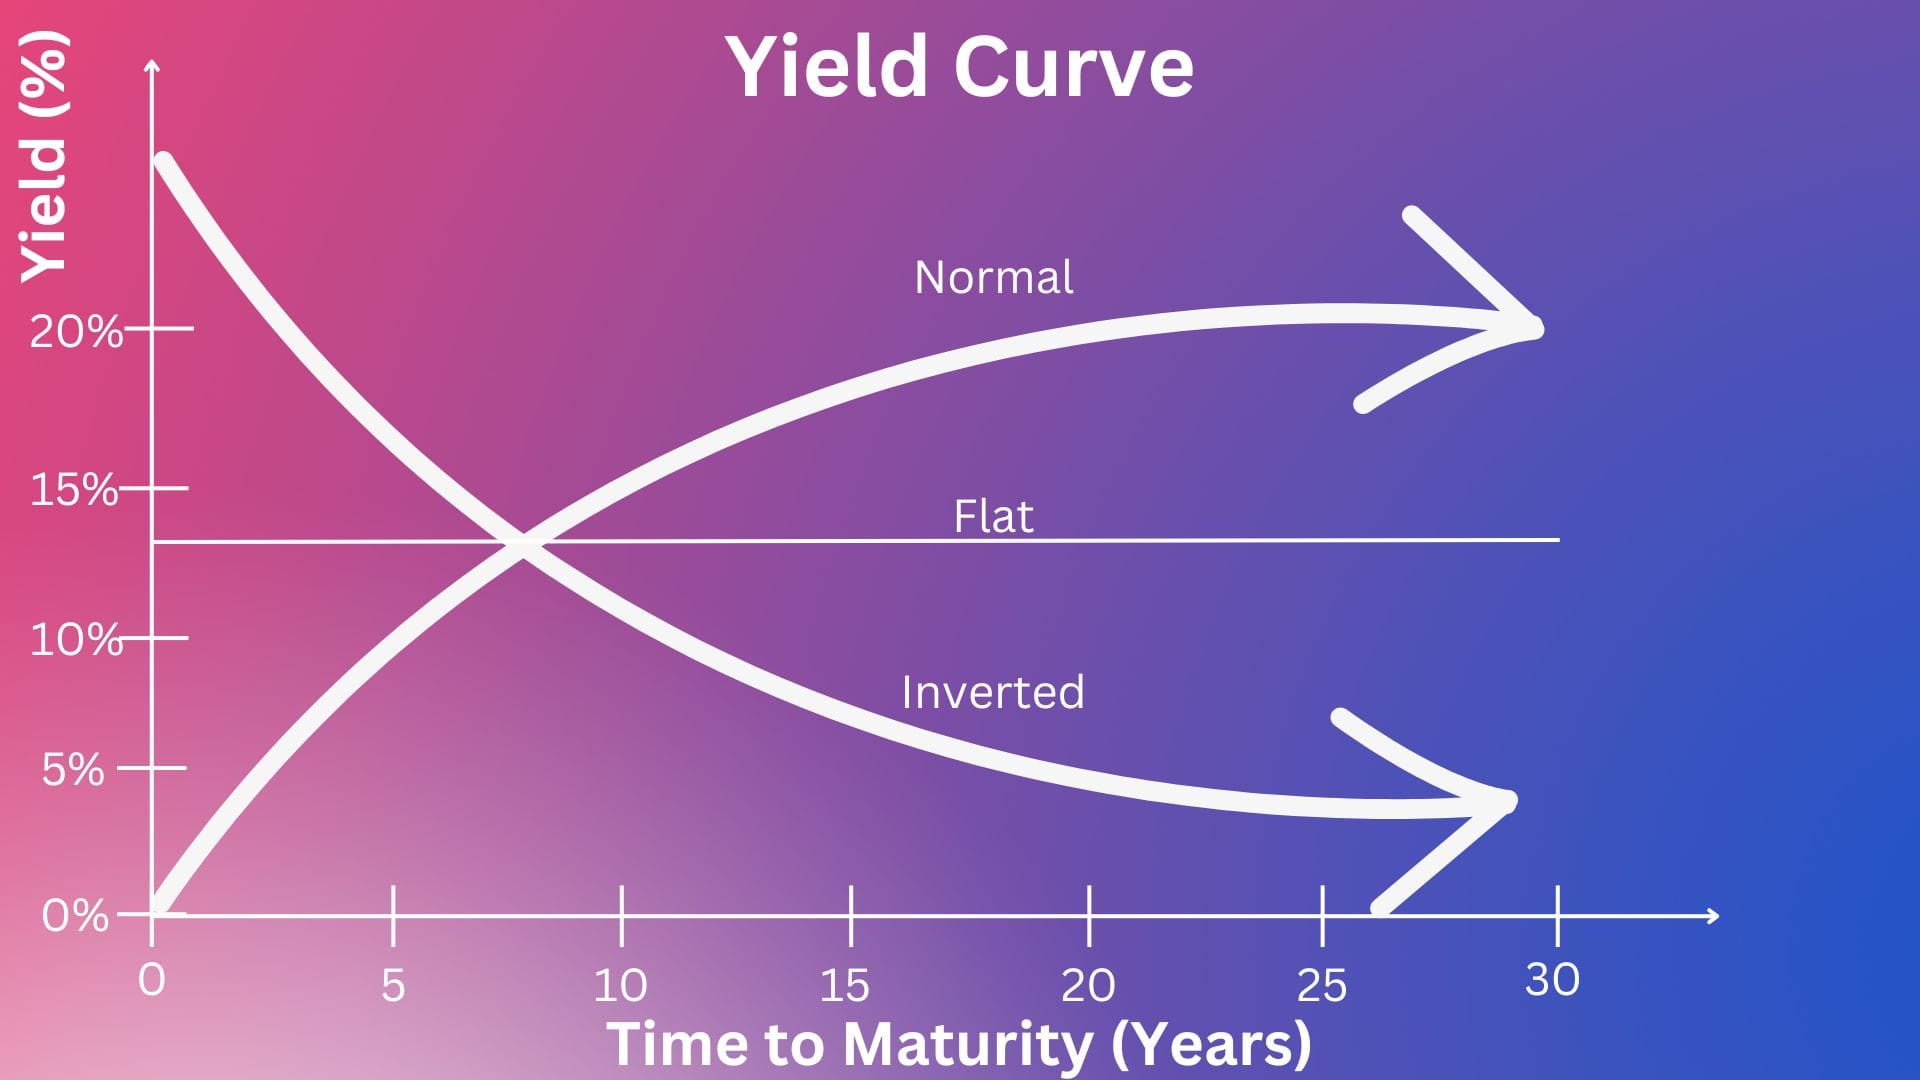
A simplified visual of the above three types of yield curves is shown below:
Okay, so we analyzed the different types of yield curves & what they mean. But what is it's relevance in understanding the economy & strategy?
Yield Curve Relevance
In any strategic decisions which involve additional investments or borrowing, understanding the economic outlook as well as the direction in which interest rates are expected to move (expectation) is critical. It impacts borrowing costs, capital allocation & investment decisions. There are two aspects to consider when understanding the relevance of yield curve :
- Economic Outlook
- Market Expectations
Economic Outlook
The Yield curve is an important tool when trying to understand the economic outlook. Let us understand how by seeing what signal each type of yield curve provides :
- Normal / Upward Sloping Yield Curve - An upward sloping yield curve indicates that investors expect long term interest rates to be higher which is associated with a strong positive outlook for the economy. This also means that inflation outlook is also higher as a result of a stronger economy. This is correlated to the start of an expanding economy.
- Flat Yield Curve - A flat yield curve indicates that investors expect long term interest rates to remain at the same level as the short term rates without any significant increase in the future. This indicates uncertainty about the economy & worries about a potential recession without tipping into one.
- Inverted Yield Curve -
- An inverted yield curve indicates that investors expect long term interest rates to be lower than the short term rates. Stable or falling long term rates typically happens when an economy slows. Investors believe current growth is stronger than future growth. Historically, an inverted yield curve has been a reliable predictor of recessions.
- As per Cleveland Fed, the rule of thumb is that an inverted yield curve indicates a recession in about a year, & yield curve inversions have preceded each of the last eight recessions. One of the recessions predicted by the inverted yield curve was in 2020. The Yield curve inverted in May 2019, almost a year before the most recent recession which started in March 2020.
- There has been two notable false positives too - an inversion in late 1966 & a very flat curve in late 1998 (Source : here)
However, as there are multiple factors & policy stances taken by Central Banks impacting an economy & it's outlook, the yield curve along with several other factors must be considered when forecasting economic outlooks.
Market Expectations
The Yield curve reflects market expectations of future interest rates providing insights into the minds of investors as to their outlook on the economy.
Yield Curve Update - 2024
Where are we now currently on the yield curve? Read on.. (Source : here)
A key bond market signal of an upcoming recession has flashed red continuously for the longest time ever, even if the U.S. economy is far from showing signs of a growth contraction.The part of the Treasury yield curve that plots two-year and 10-year yields has been continuously inverted - meaning that short-term bonds yield more than longer ones - since early July 2022.
That exceeds a record 624 day inversion in 1978, Deutsche Bank said in a note on Thursday.A 2/10 curve inversion is a time-honored signal of an upcoming recession. Short-term bonds yield more than longer maturities because investors expect interest rates to remain high in the short term as the Federal Reserve battles inflation, while long yields are lower on expectations the central bank will cut interest rates to stimulate a weakening economy.An inverted yield curve is also by itself typically bad for economic activity and financial markets because higher short-term yields lift borrowing costs on consumer and commercial loans, while lower compensation for long-term lending discourages risk-taking.
This shows that even though the US Treasury yield curve is inverted, the economy is still going strong. But the question is how long will it last?