Strategy Byte - Week 40 Market Equilibrium

Table of Contents
- Recap
- Market Equilibrium
- The Bathtub Theorem
- Moving Forward
Recap
During Week 39, we dived deep into Supply by discussing Supply Curve / Supply Schedule.
A supply schedule is a tabular representation of the relationship between the price of a good or service & the quantity suppliers are willing & able to supply to the market, all things remaining equal.
We discussed Supply Curve which is a graphical representation of a supply schedule which shows the quantity supplied on the x-axis & price on the y-axis.
We then explored the factors that causes change in supply which results in the supply curve moving right or left depending on whether the factors cause an increase or decrease in supply respectively.
- Cost of Production
- Price of related goods
- Expected future prices
- No. of suppliers &
- Technology & Innovation
Then we discussed Elasticity / In-elasticity of Demand.
Before we move forward, we need to explore one last concept under Supply & Demand - Market Equilibrium.
Market Equilibrium
Let us first understand what does equilibrium mean. There are multiple definitions - the one relevant for us is
a state of balance, especially between opposing forces or influences
(Source : here)
So, we can see from the above that if there are two opposing forces or influences & they balance each other without letting one have extensive influence over the other, then there is equilibrium.
A very simple example of equilibrium is a seesaw where the weights of two sides balance out when they are equal & the seesaw stays horizontal. The horizontal position of the seesaw is an equilibrium position. Any other position represents disequilibrium when one side weighs more than the other.

So, what does equilibrium mean in the context of supply & demand? Here the two opposing forces are - Supply & Demand.
Let us see both the supply & demand curves discussed in prior weeks.
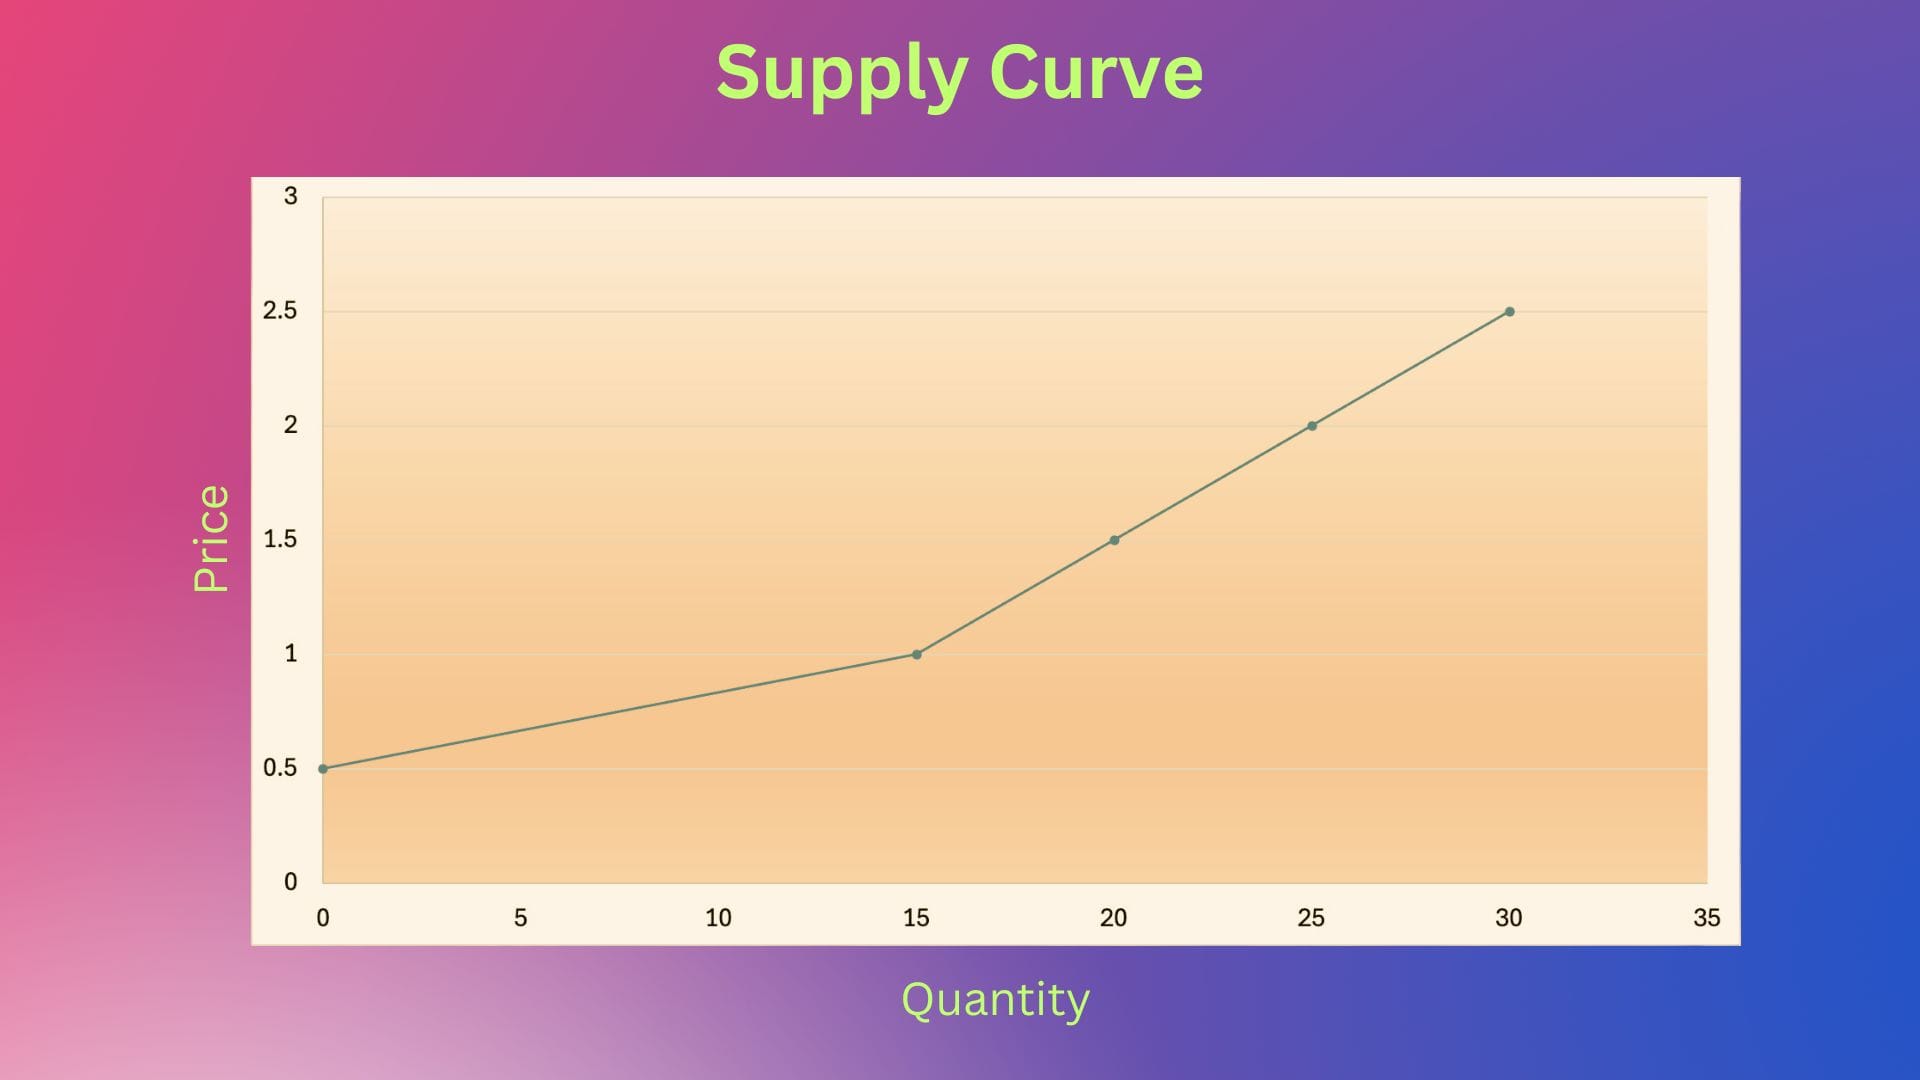

So,
- Based on the demand curve, if price increases, quantity demanded decreases & vice versa
- Based on the supply curve, if price increases, quantity supplied increases & vice versa
So price changes impact supply & demand differently & in opposite directions. Thus, these are opposing forces as per our definition above.
Let us put both the above curves in one graph as below :
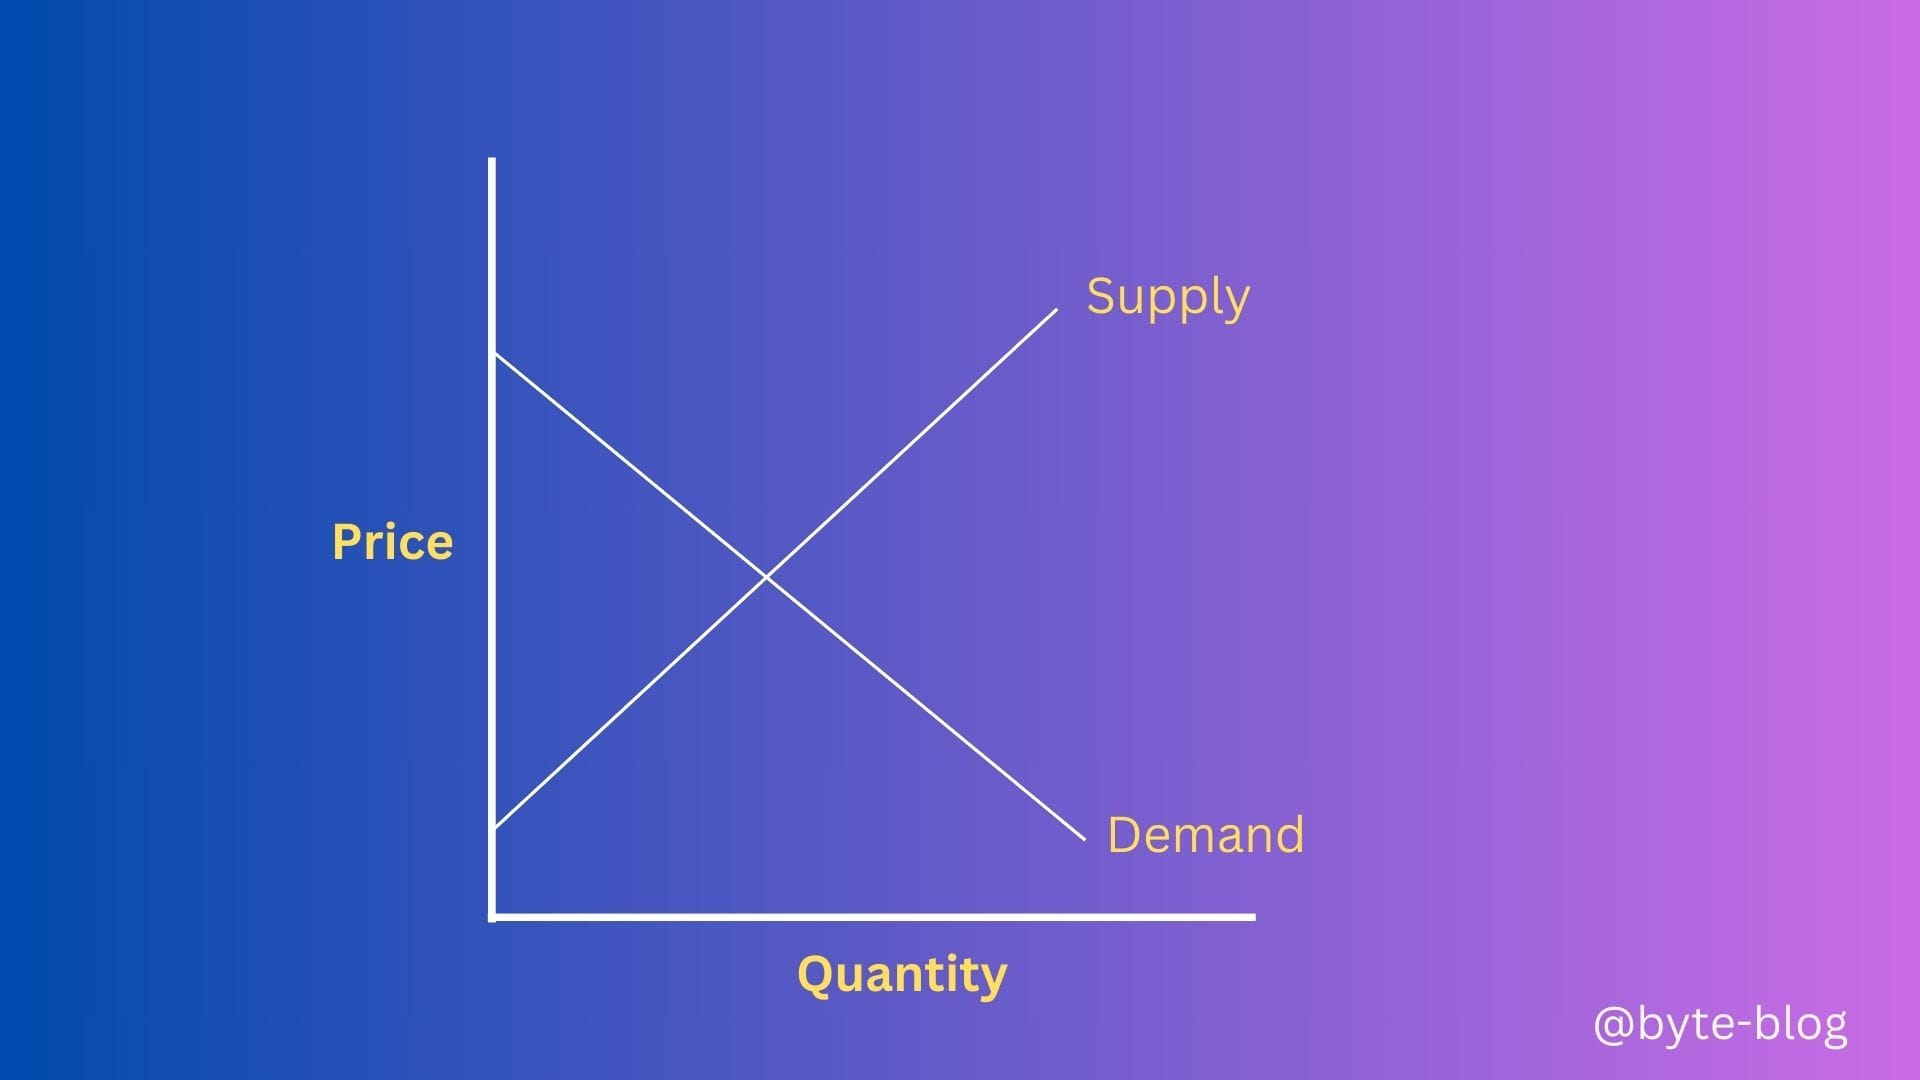
If we look at the above graph with both supply & demand curves combined, we can see a point where they both meet. What does it mean? Let us leave the above diagram incomplete for now.
Let us now understand a concept from systems thinking called The Bathtub Theorem. (Source : here)
The Bathtub Theorem
Imagine a bathtub where water enters the tub via the faucet & exits through the drain. These two flows of water - the inflow & the outflow - together determine the water level & stability of the bathtub. To maintain a constant level, the inflow must equal the outflow.
So, if inflow of water = outflow of water, the water level remains the same
Visualizing the above:

What will happen if one exceeds the other,
If inflow > outflow, the water level will increase & the tub will overflow
If inflow < outflow, the water level will decrease & the tub will be empty after sometime.
If we consider -
- The faucet, tub & drainage as parts of the system
- The inflow / outflow as the variables impacting the system
What does it ultimately impact ? - The water level.
Coming back to supply & demand, let us visualize supply & demand as the parts of the economic system of some particular goods / services.
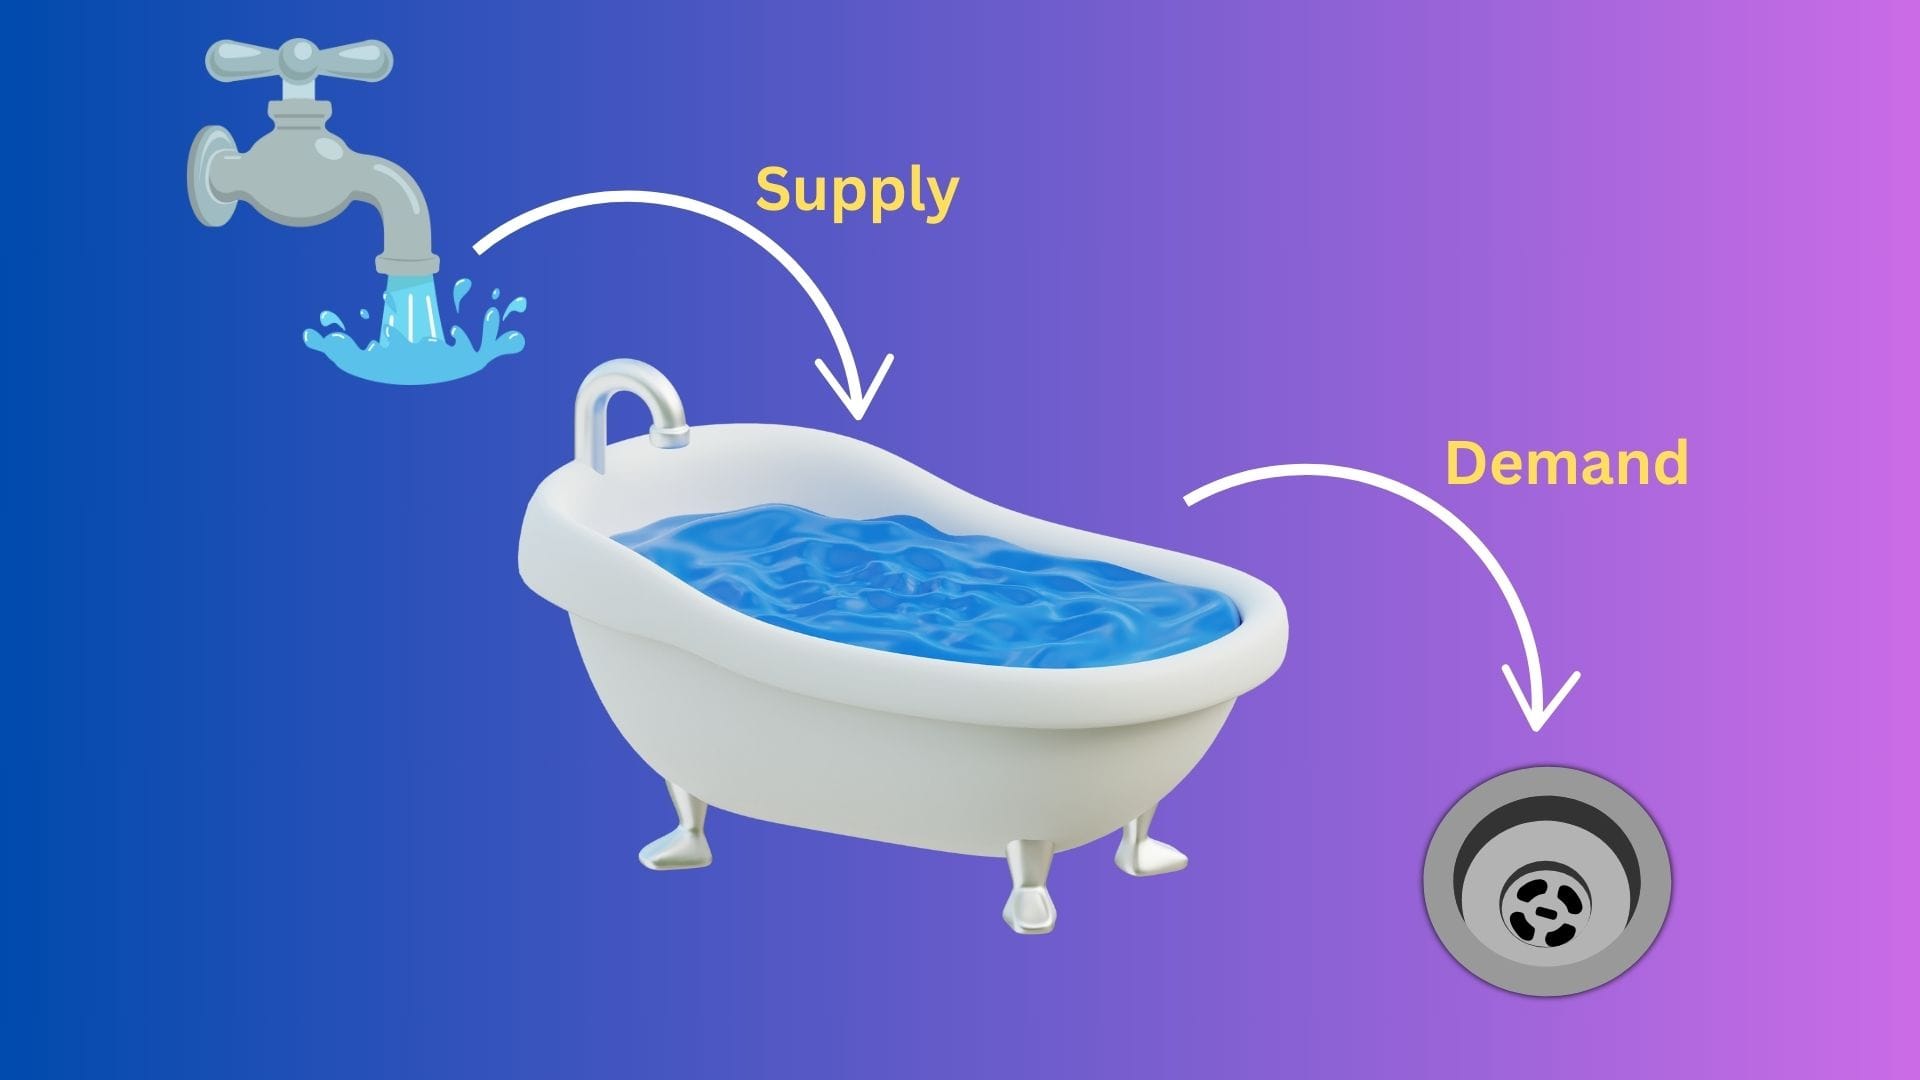
What will happen if Supply exceeds Demand ? - Producers will produce less of the goods / services as they will not be able to sell all their produce & hence the price of those goods / services decreases.
But when the price decreases, demand picks up.
What will happen if Demand exceeds Supply? - Producers will produce more of the goods / services & hence the price of those goods / services increases.
But when the price increases, demand reduces.
(Recap - The Law of supply shows a positive relationship between price & quantity supplied of a good / service while the Law of Demand shows an inverse relationship between price & quantity of goods demanded)
What do the above variables ultimately impact ? - The Price.
The Price is analogous to the water level in our visualization.
Visualizing the above
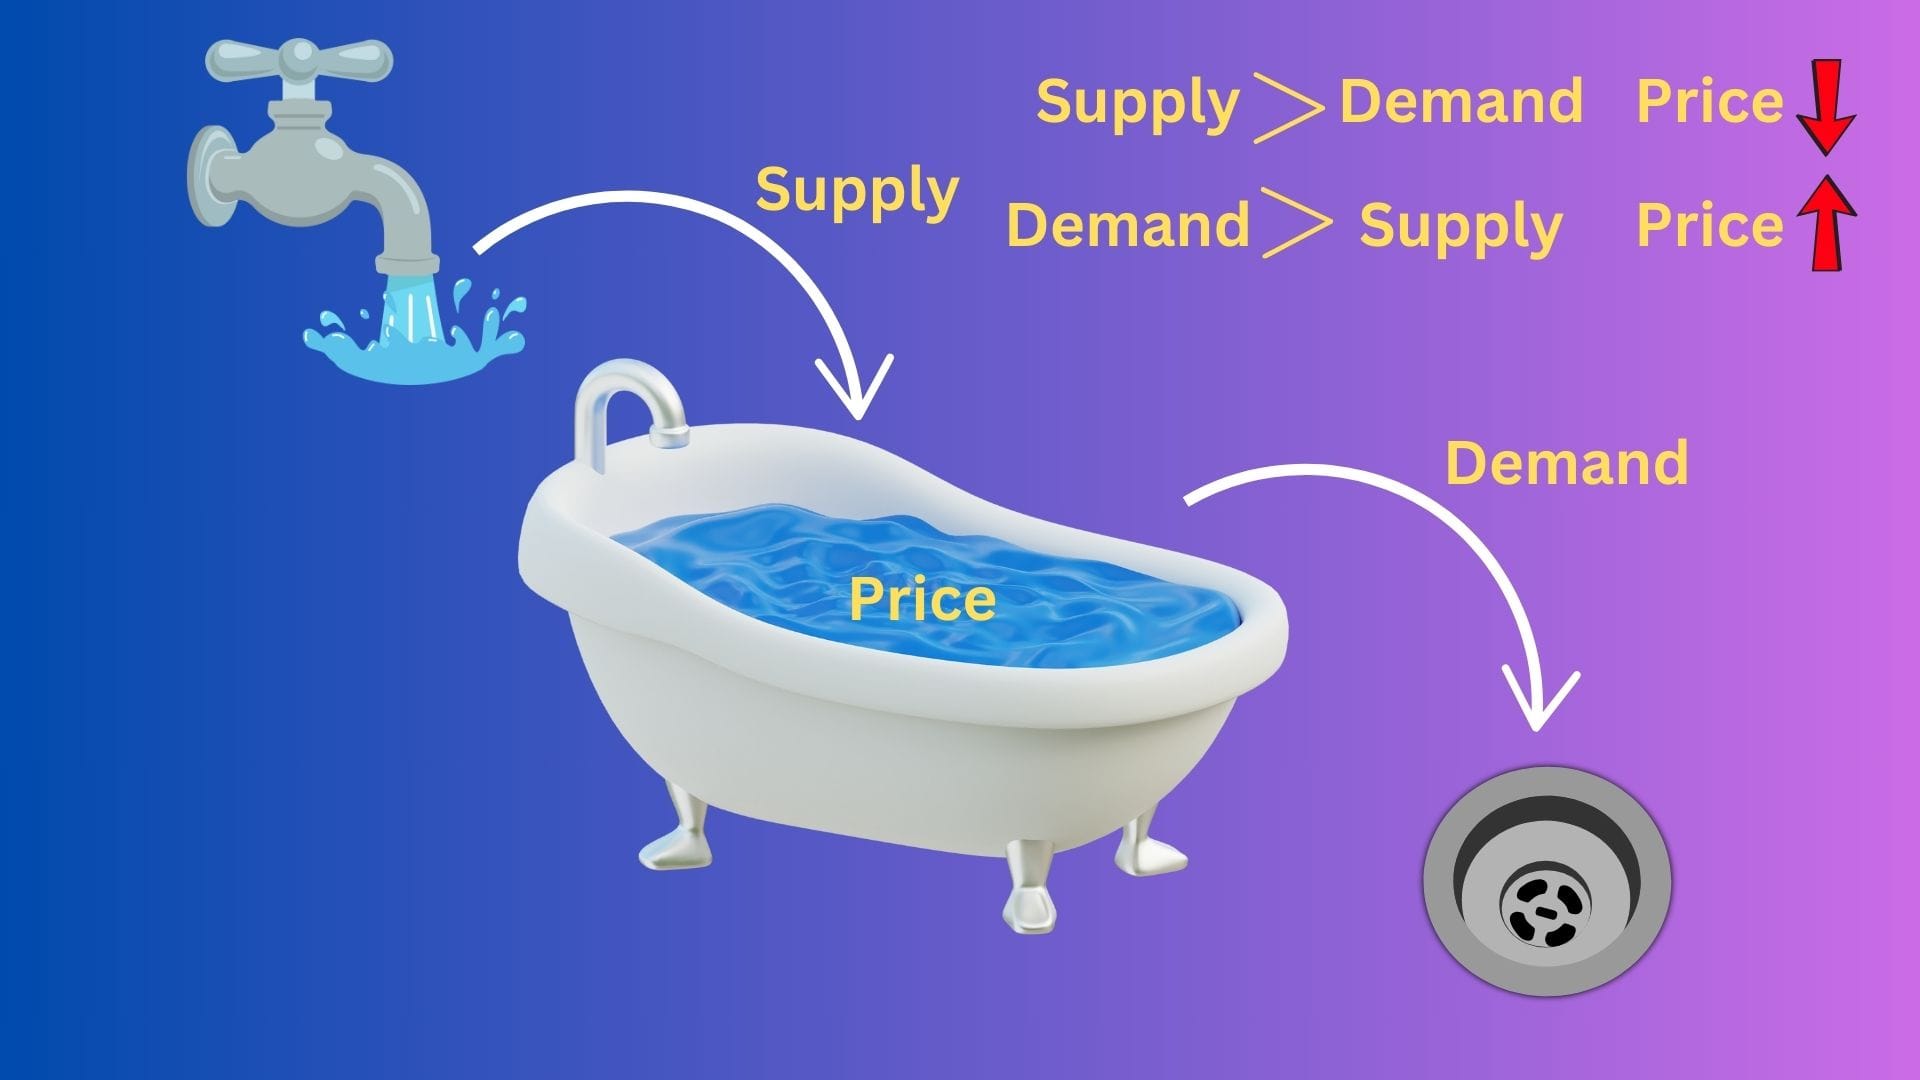
So, there is a constant tension between demand & supply reflected in price variation.
We didn't cover one scenario above, what if demand = supply? In the Bathtub theorem, there is a constant level maintained when inflow of water = outflow of water. That is called the equilibrium level of the water in the tub.
Just like there is an equilibrium level for water when the inflow = outflow, there is an equilibrium price when demand = supply.
This means that at this price, the quantity demanded = quantity supplied. This equilibrium level is called Market Equilibrium
Let us now revisit our incomplete diagram - the point where the supply & demand curves meet (where supply = demand) is called the Market Equilibrium.
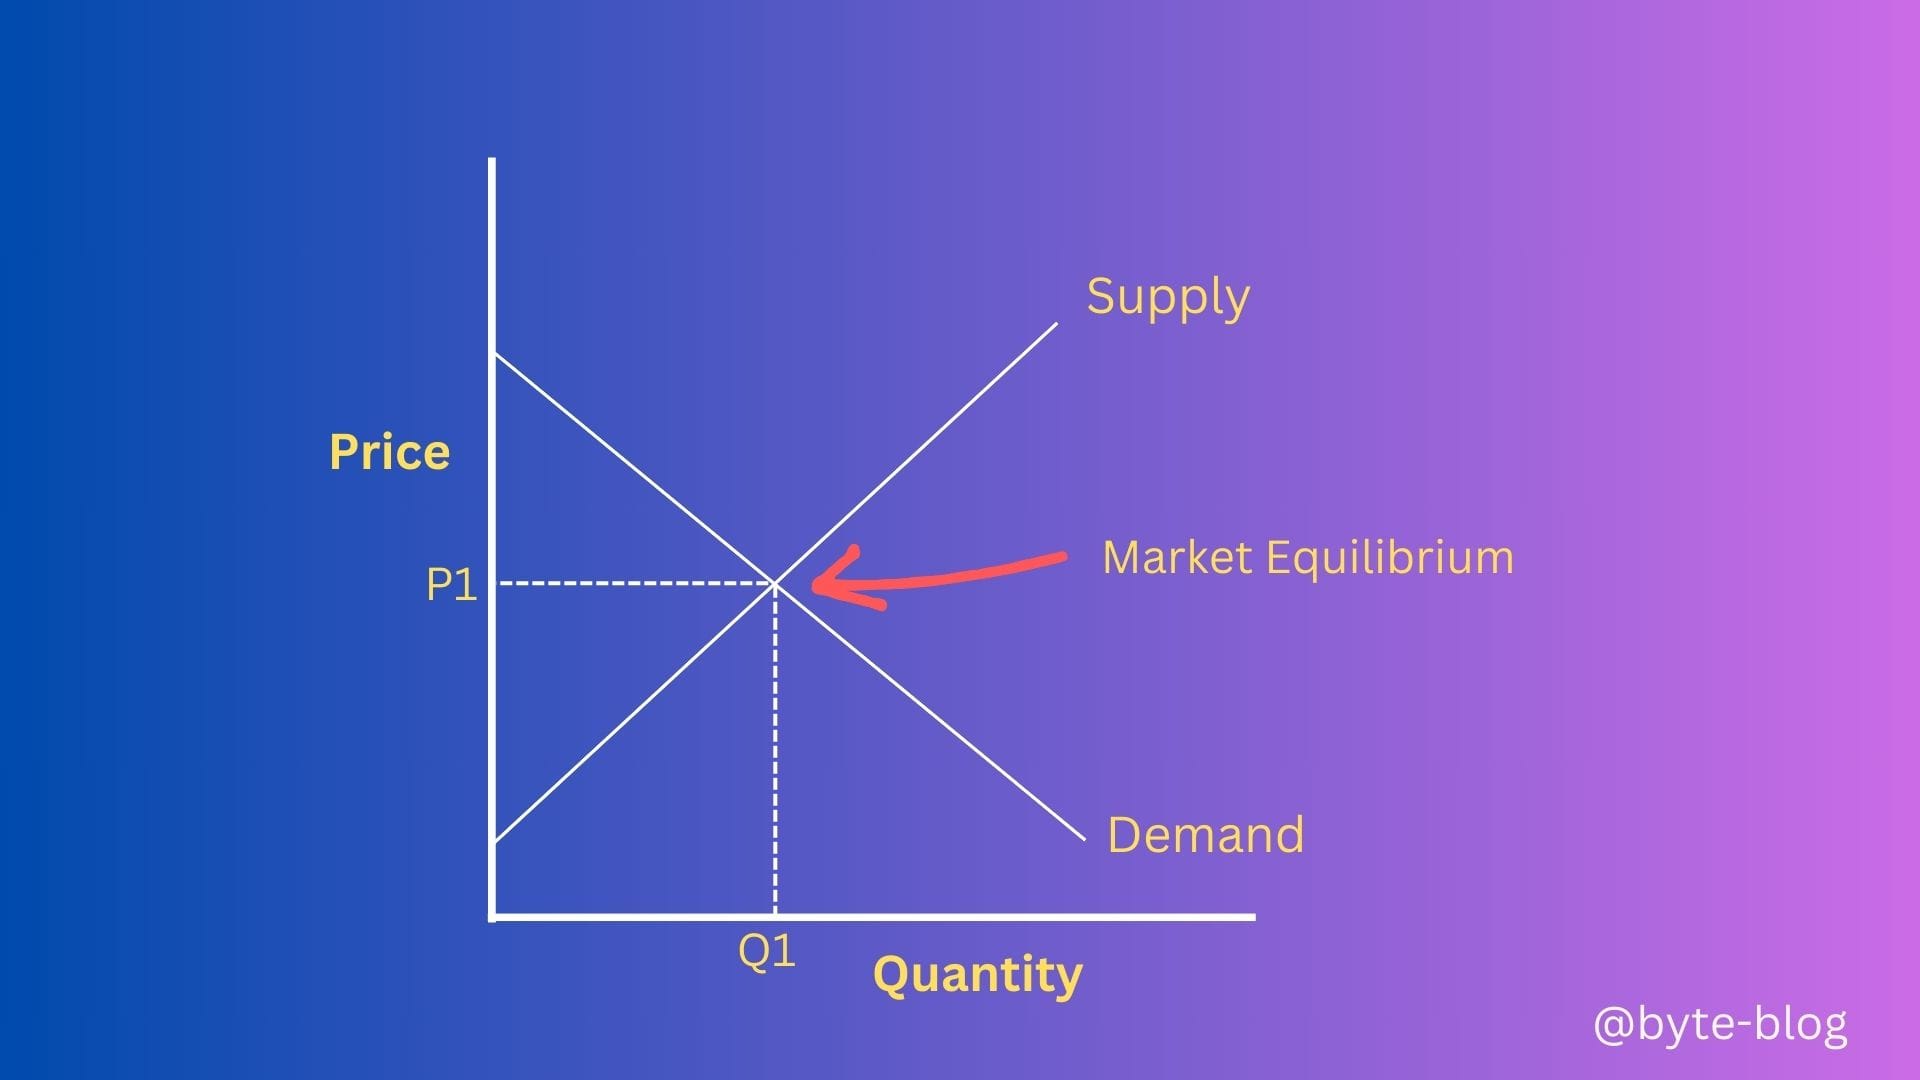
In the diagram above, Q1 is the quantity & P1 is the price where supply = demand. When a market is in equilibrium, prices do not generally tend to change.
But in real life, demand does not equal to supply causing disequilibrium which causes firms to change prices in line with actual supply & demand. Market equilibrium is more of a dynamic state depending on the supply & demand. Understanding this helps to analyze how prices can fluctuate in line with either variation in supply or demand.
Moving Forward
With this, we have come to an end of the first series of Strategy Byte where we explained the various macro economic variables. How do these variables factor in our strategy choices?
We will tie up all that we discussed over the last 40 weeks with specific focus on Real Estate Sector as I promised last week.
