Strategy Byte - Week 52 Automotive Industry - Lay of the Land

Table of Contents
- Recap
- Industry Analysis - Market Size
- Core Value Chain
- Ancillary Segments
- Segment Contribution
- Core Value Chain - Deep Dive
- Market Concentration
- Summary
- Next Steps
- Supporting References & Assumptions
Recap
We started our deep dive into Industry Analysis by starting with the Automotive industry. The story so far....
We designed a template to ensure we follow a logical sequence for analysis :
- What is the automotive industry? How is it segmented?
- How is the value chain structured in the automotive industry?
- Who are the players in the value chain of the automotive industry?
- How does each player contribute to the value chain?
- What are the important customer segments?
- What are the regulations governing the automotive industry?
- What is the unit economics of the industry?
- What are the new developments or disruptive forces in the automotive industry?
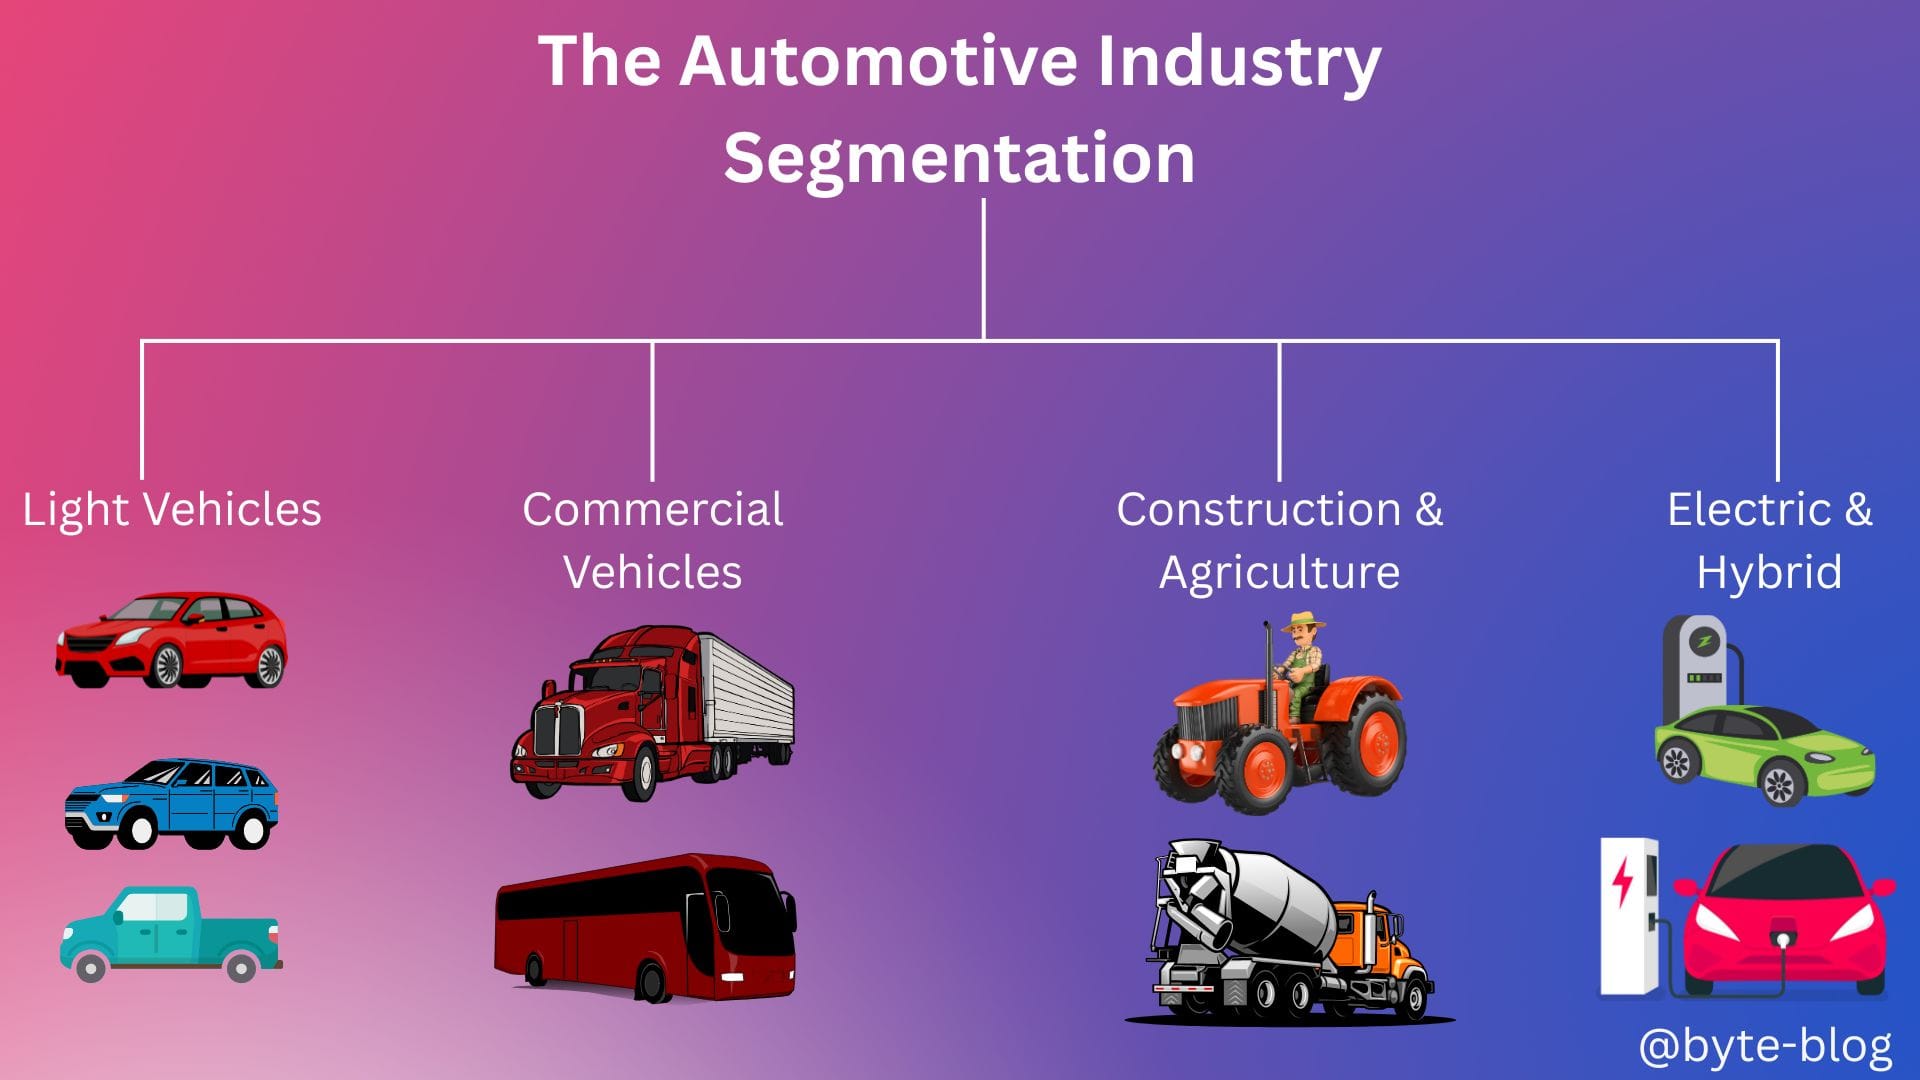
We discussed segmentation by vehicle type as visualized below:
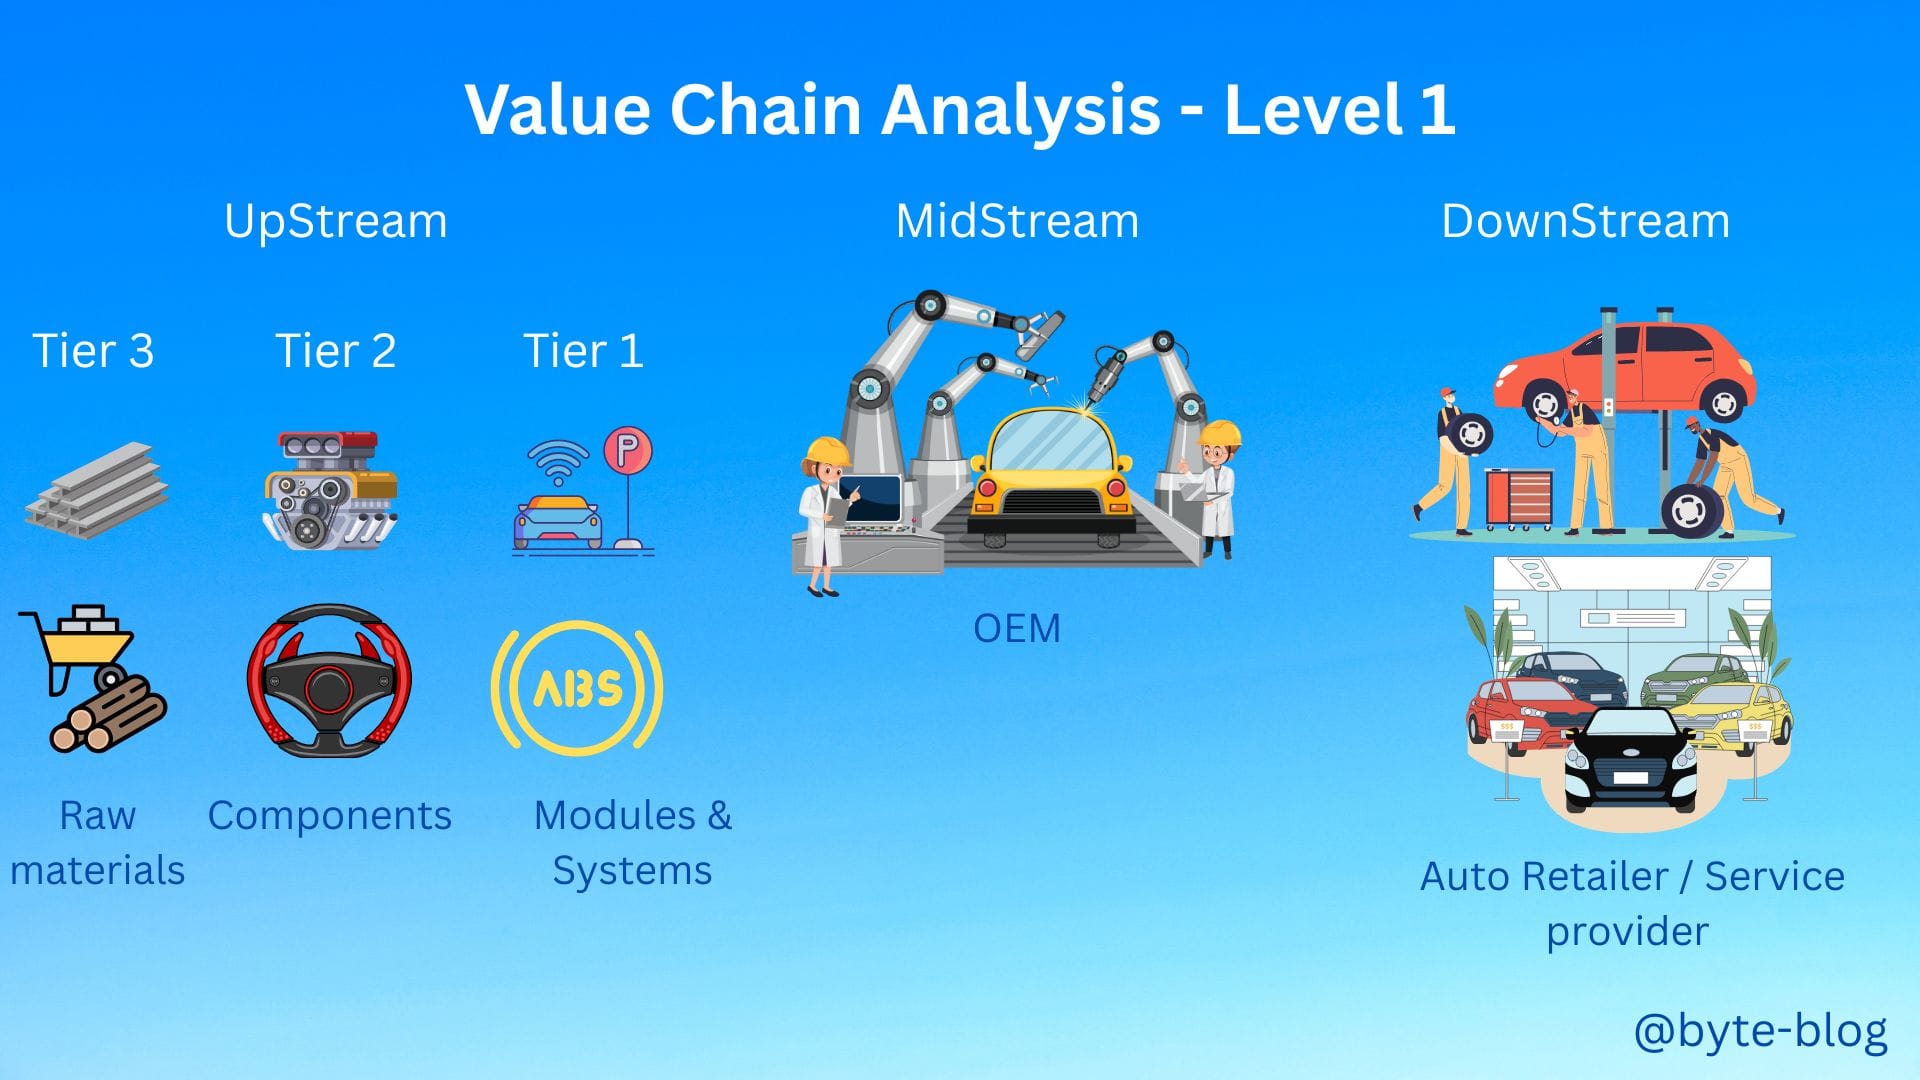
Then we explored the industry value chain analysis at two levels :
Level 1 - where we categorized the value chain into
- Upstream Segment
- Midstream Segment &
- Downstream Segment
Visualizing the above :
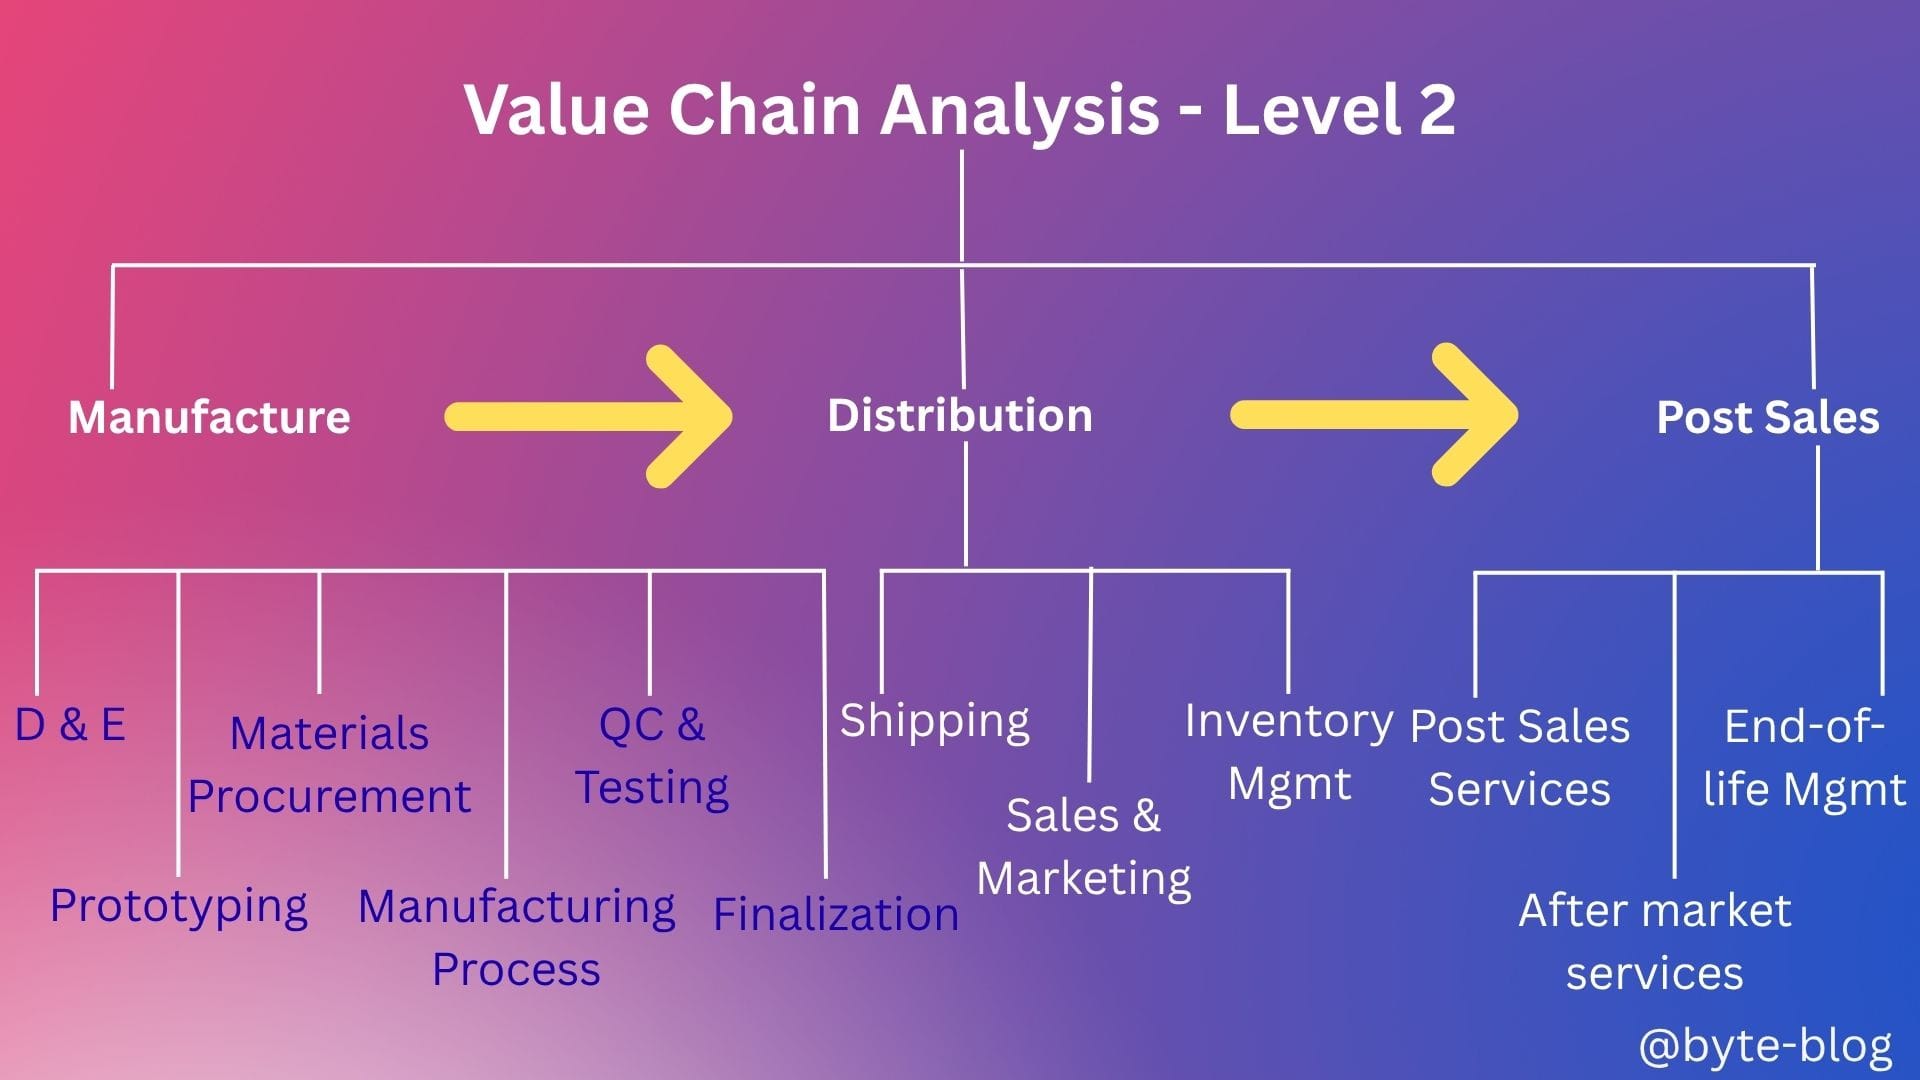
Level 2 - where we broke down the end-to-end processes from concept to sale & after sales service of an automobile as visualized below :
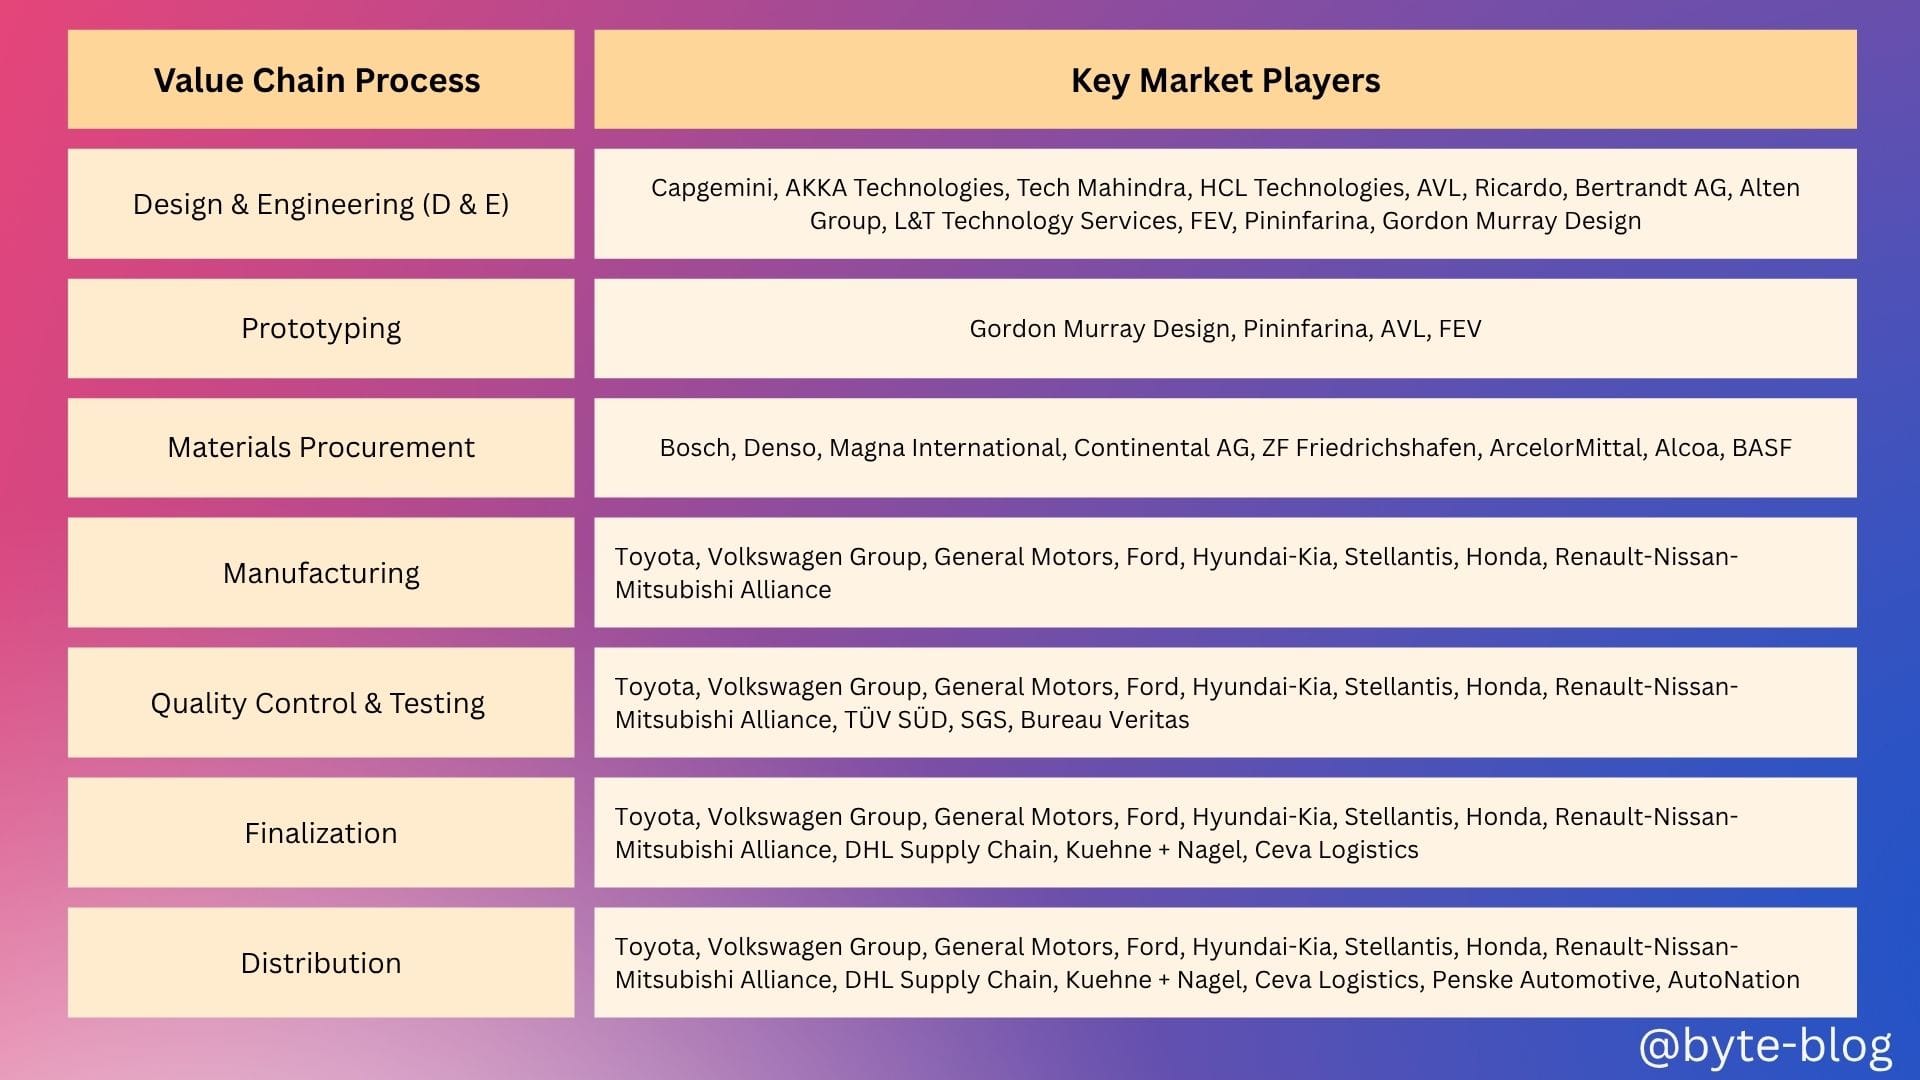
We then identified the key players in each segment as below :
This week, let us understand the lay of the land in Automotive Industry by understanding Market Size & Composition
Industry Analysis
Global Market Size
Let's start from the top of the pyramid & then go down step by step into the details (Inspired by Barbara Minto's "Pyramid Principle"):
- We will start with the total global market size & break it down by components in line with the value chain
- We will then analyze individual market segments within the value chain to understand the key players within those segments by market share
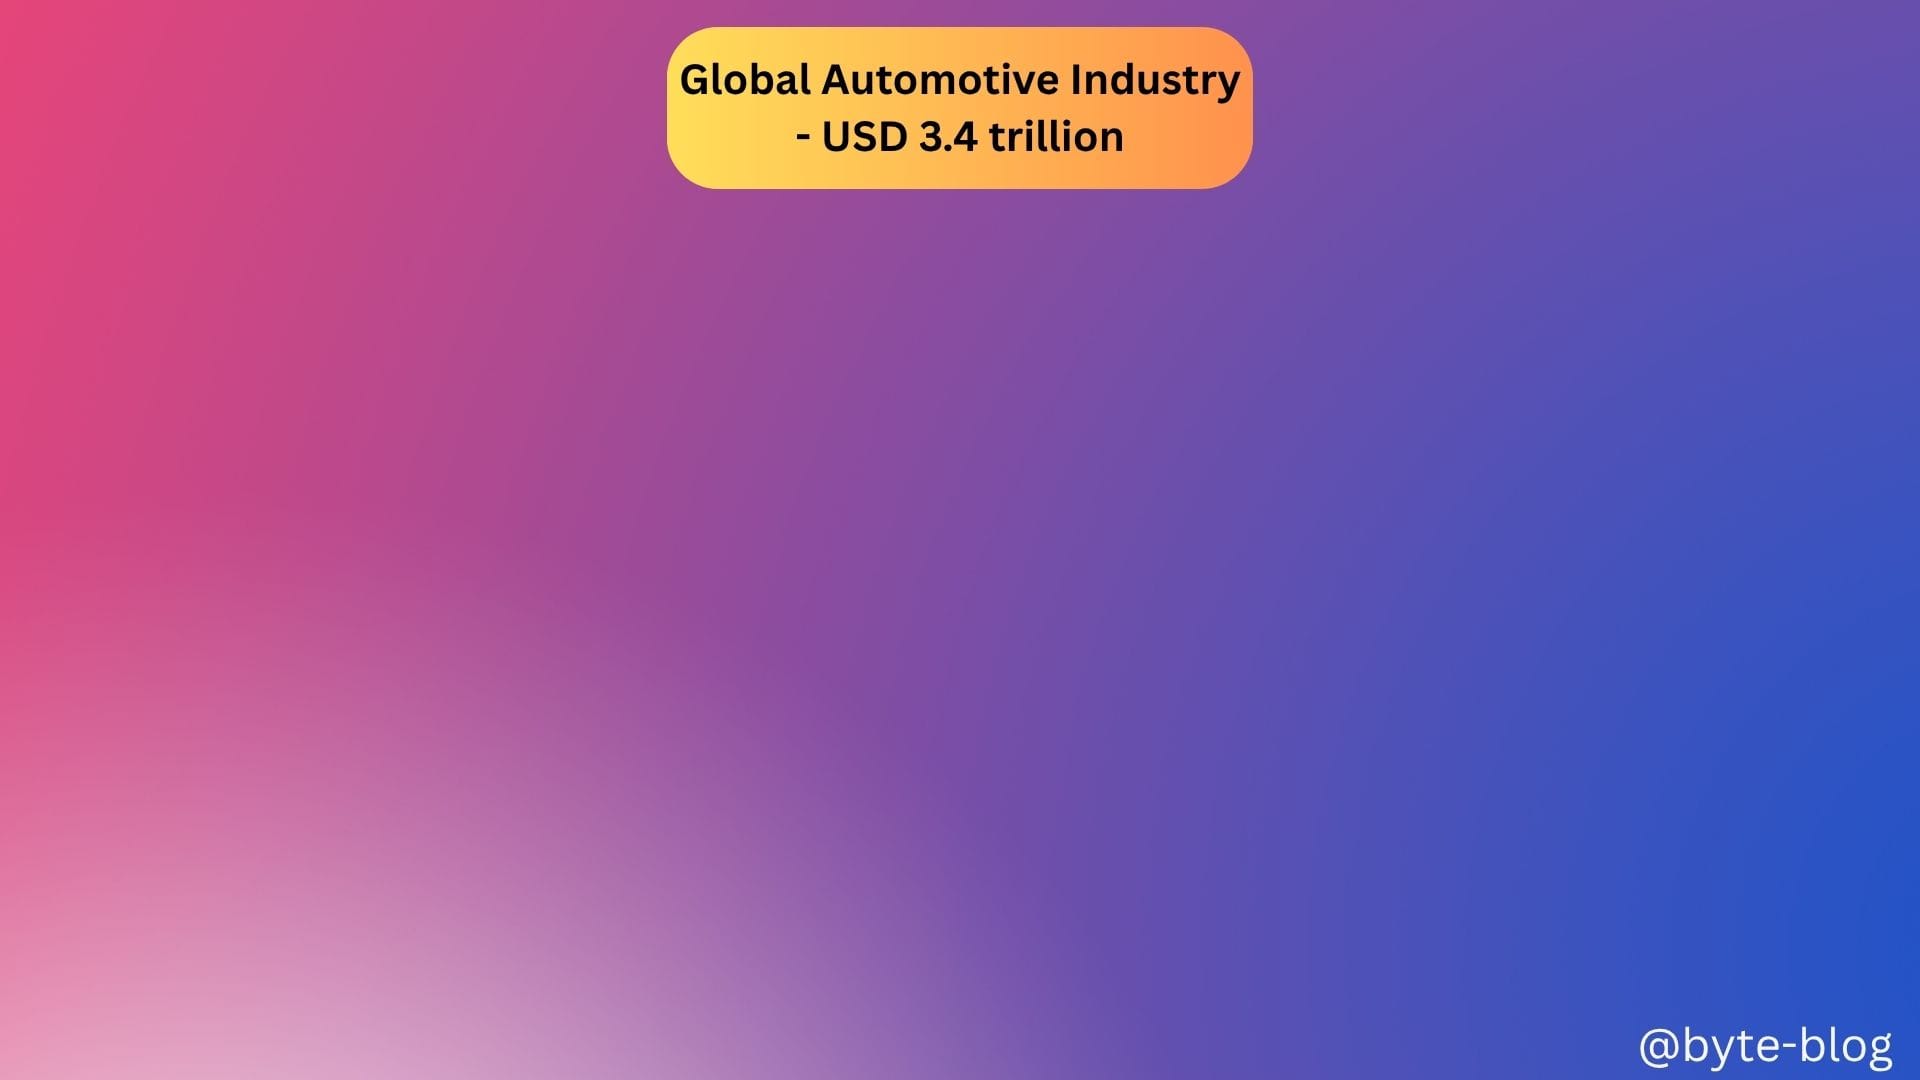
The global automotive industry size is USD 3.4 trillion encompassing a complex value chain from design & engineering to distribution & after-market services. dominated by a relatively small number of key players across different value chain segments.
Let us do a moving visual to update the numbers as we explain them :
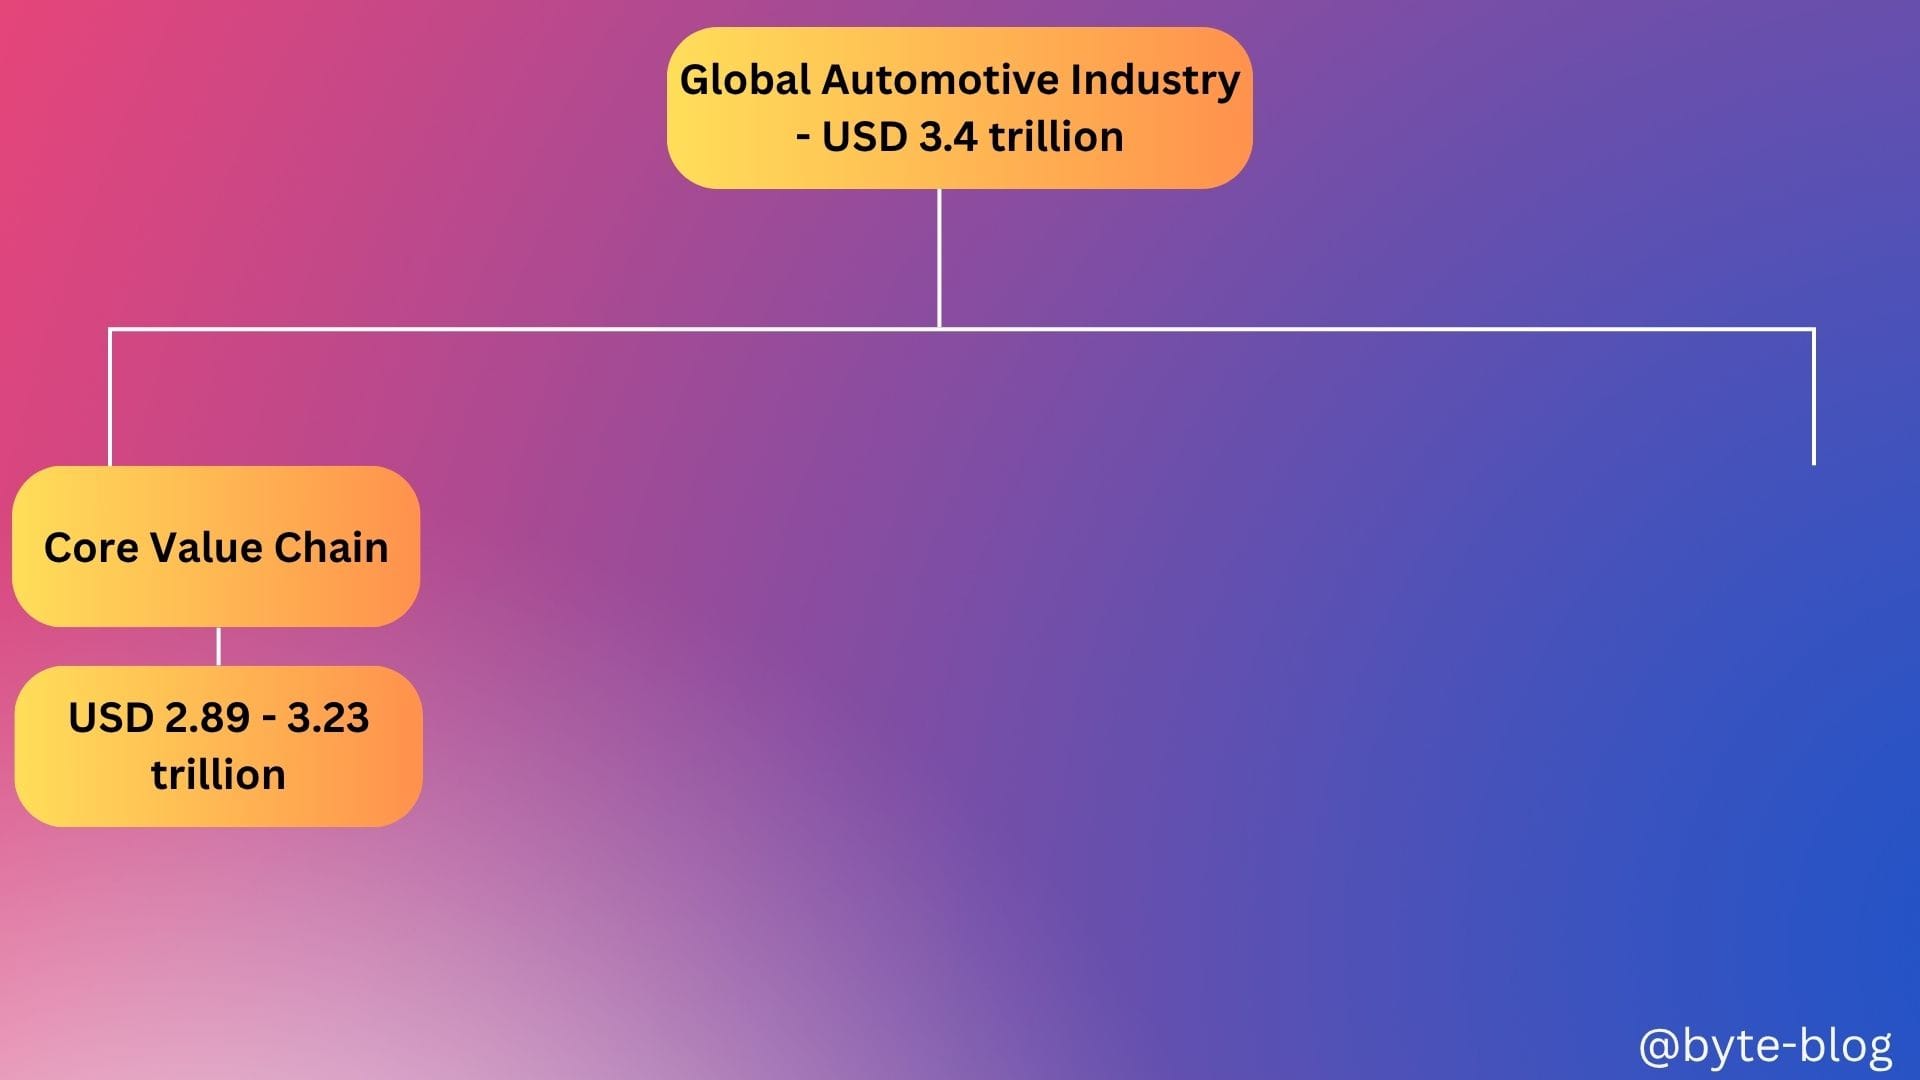
The global automotive industry value chain is divided into :
- Core Value Chain
- Ancillary Segments
Core Value Chain
Core segments relate directly to building, engineering & shipping vehicles focussed on direct value creation within the manufacturing & supply chain. It comprises of :
- Raw material suppliers
- Component Manufacturers
- OEMS
- Engineering, Design & Software
This segment accounts for nearly USD 2.89 - 3.23 trillion out of the total value of USD 3.4 trillion.
Updating our visual :
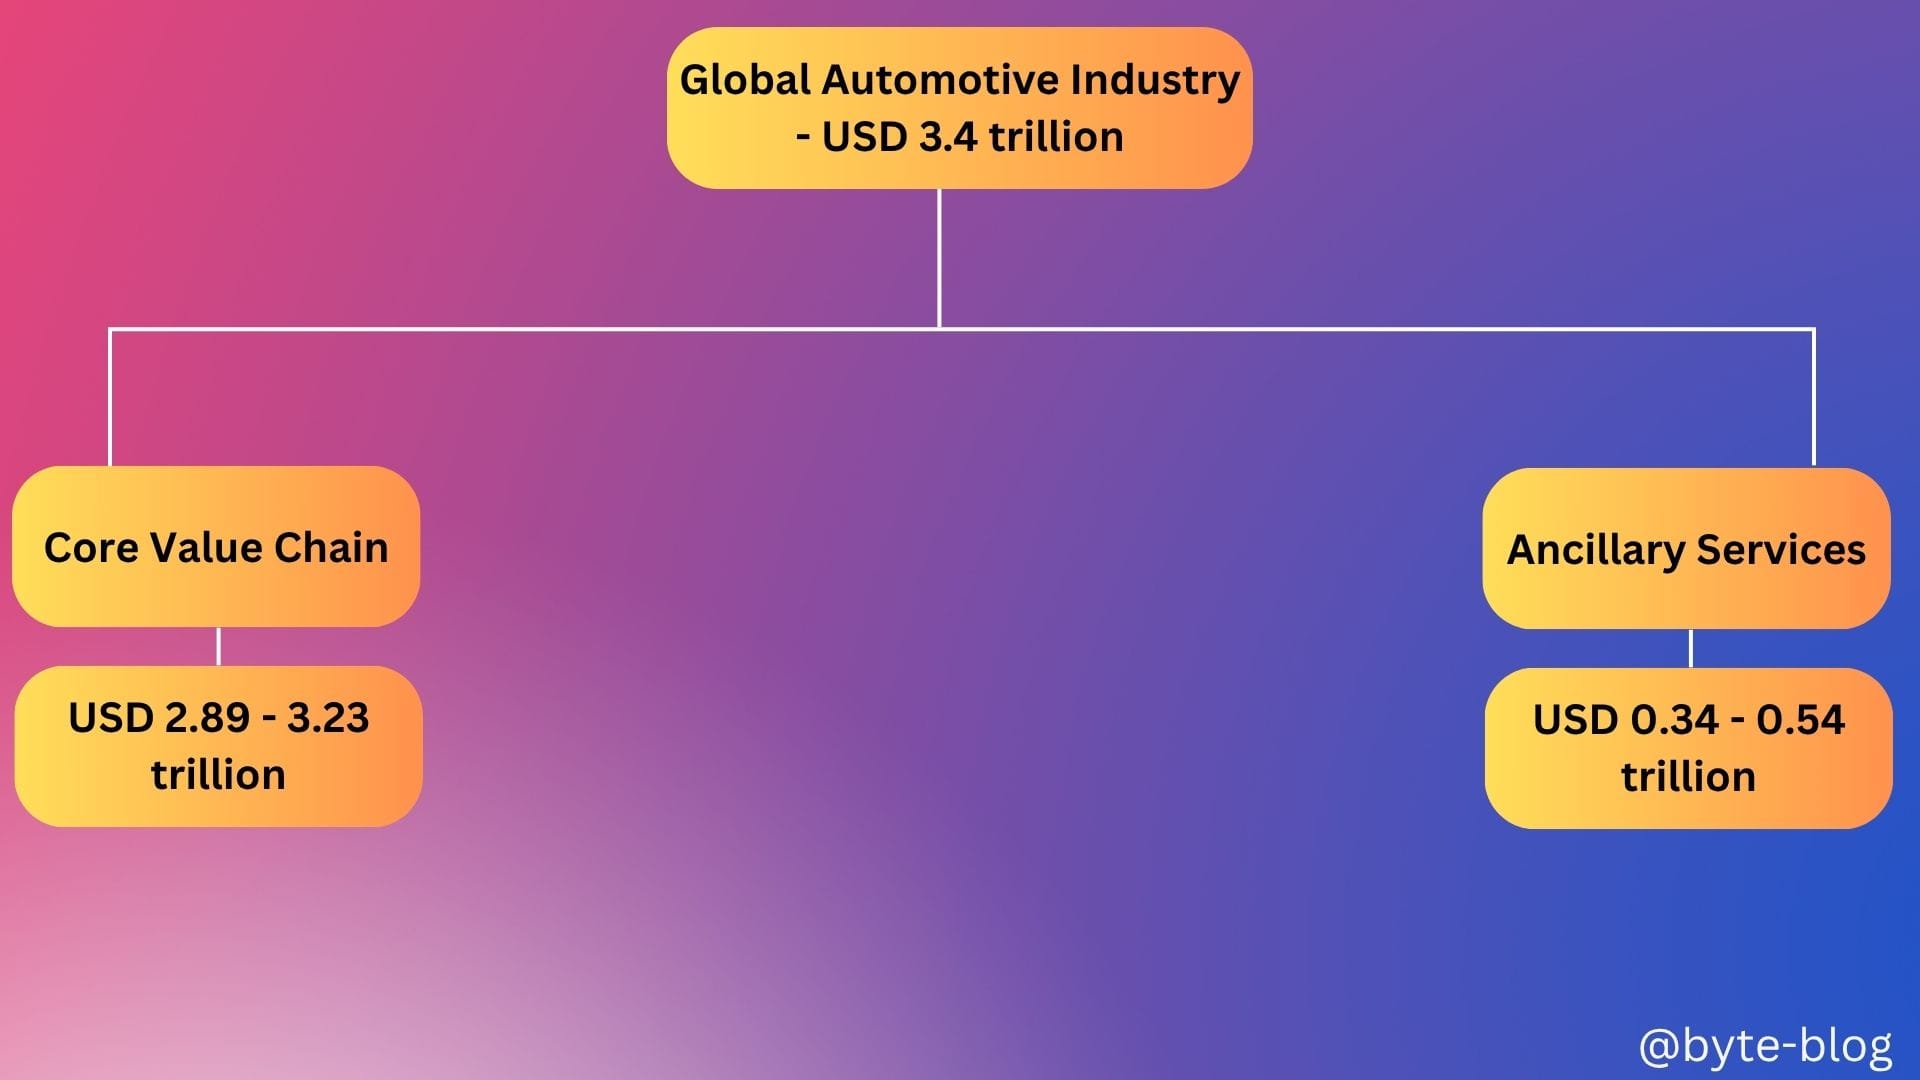
Ancillary Segment
The Ancillary segment relates to the wide array of ancillary & adjacent sectors not included in the core value-chain breakdowns such as automotive retail & dealership, aftermarket services (maintenance, repairs, parts, accessories), automotive finance & insurance, road infrastructure & tolls, leasing & rental services, used vehicle markets etc.
This segment contributes approx. USD 0.34 - 0.54 trillion which are essential to the functioning of the automotive industry but are not part of the direct manufacturing & supply chain.
Updating our visual :
Let us now see the proportion of each activity within the core / non-core segment which contributes to the overall market size of USD 3.4 trillion.
Segment Contribution
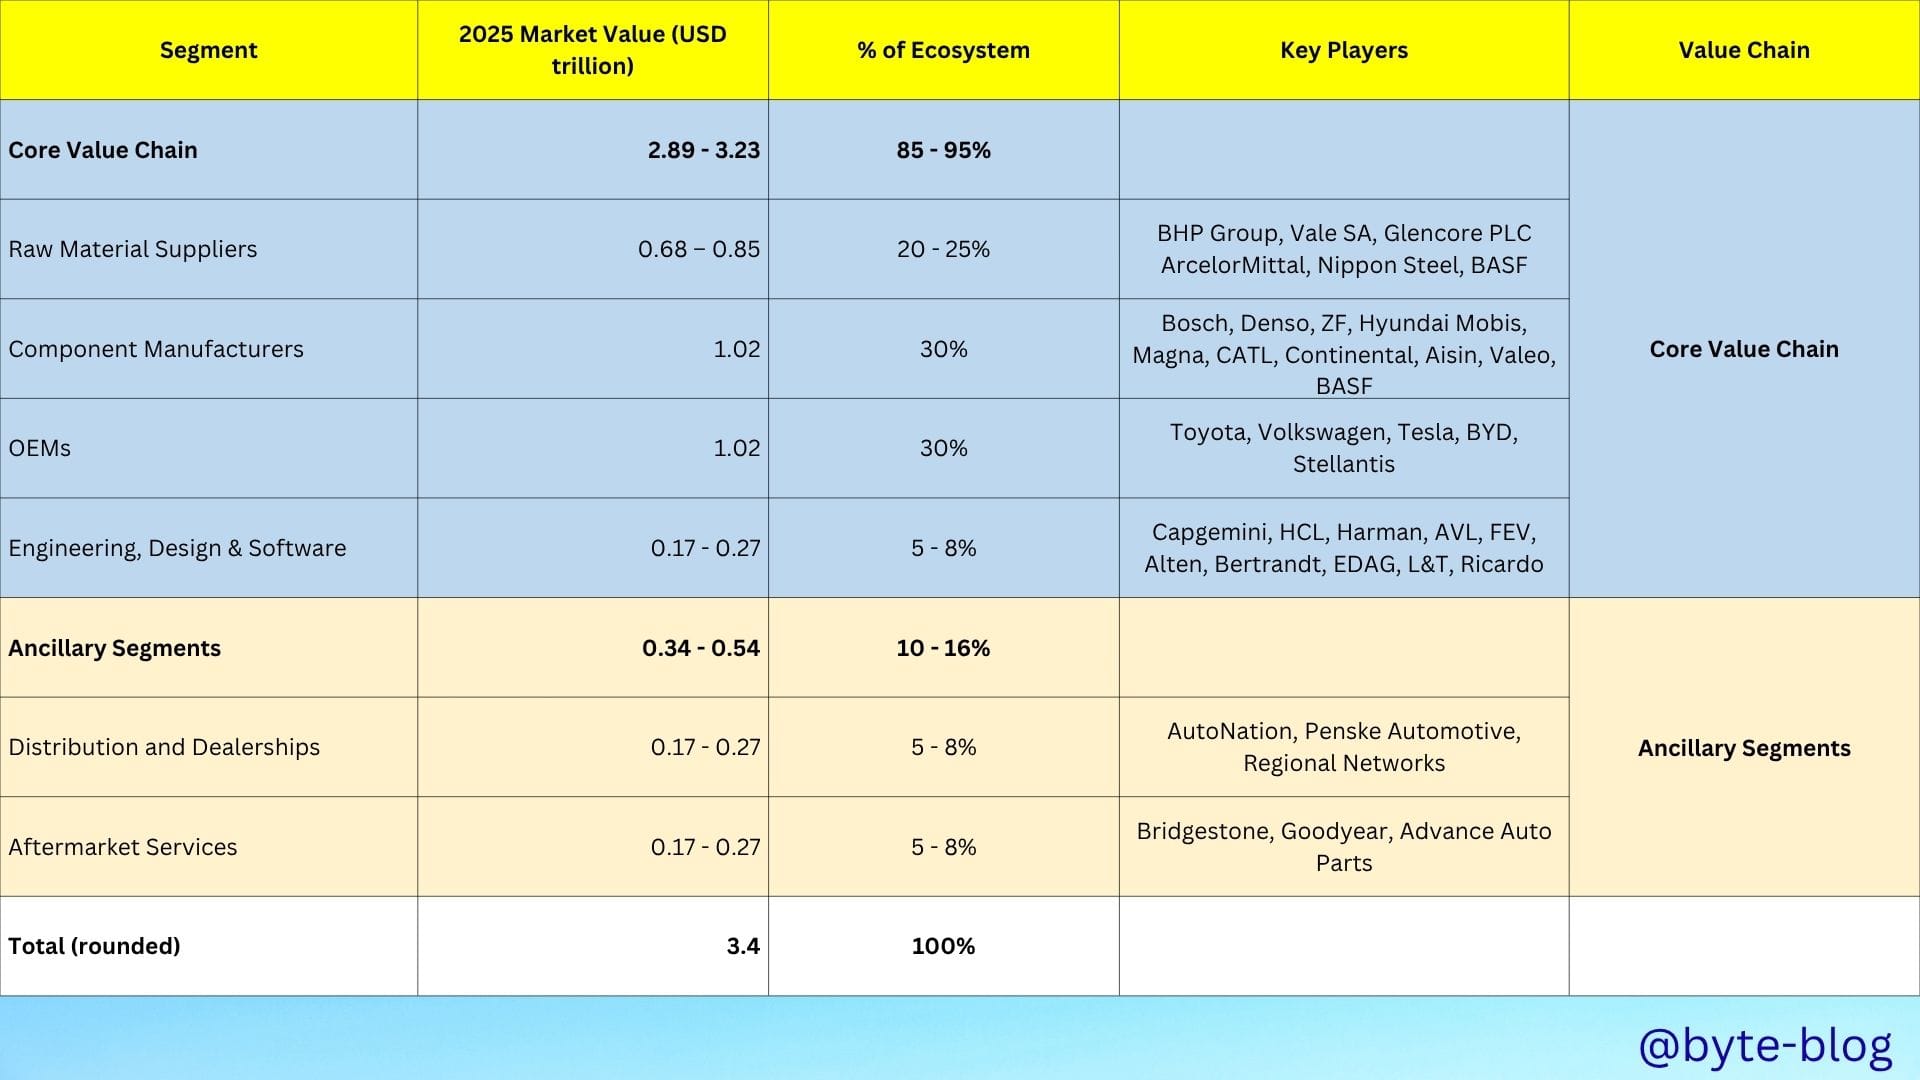
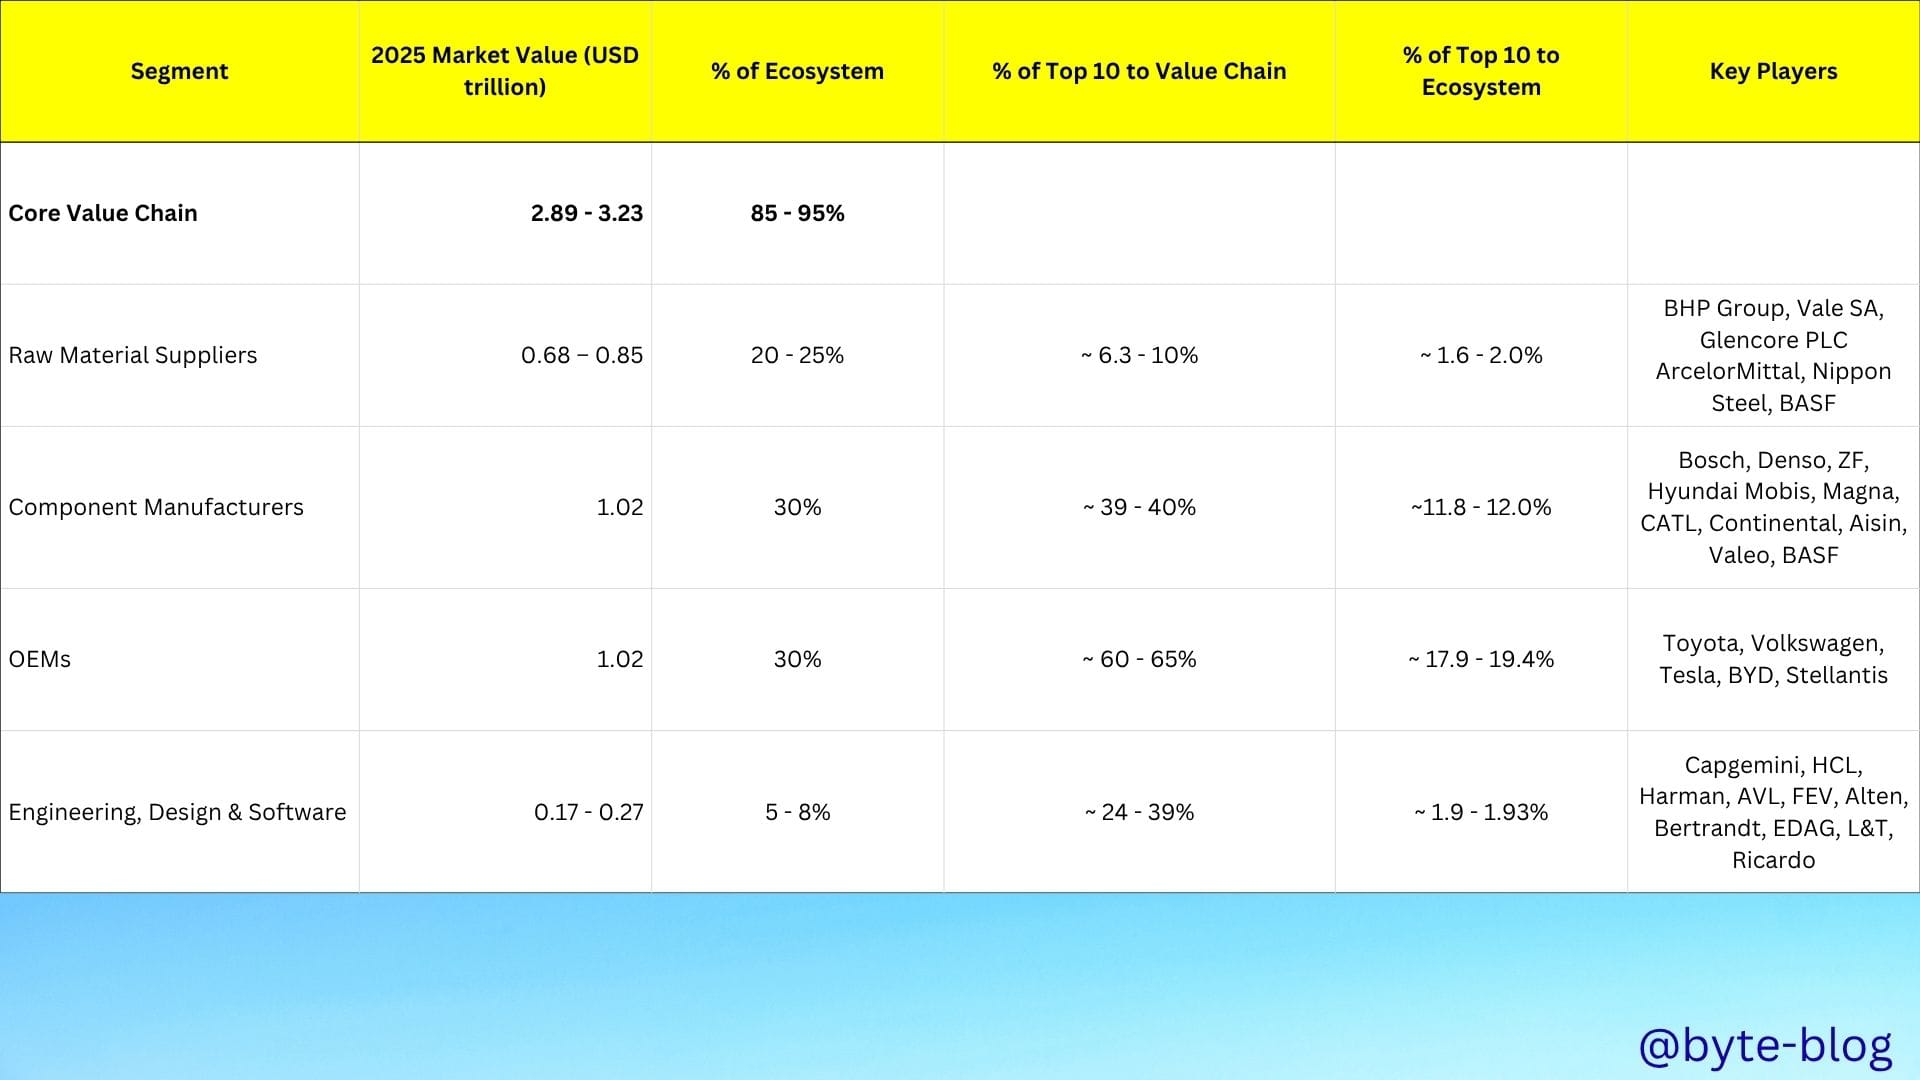
Now that we have an idea of the overall automotive industry market size & the contributors from the value chain & ancillary segments, we will focus on the core segment of the value chain by starting with the total market share & that held by top 10 players in each segment to analyze the concentration.
We will use the above table for the below analyses.
Core Value Chain - Deep Dive
Out of USD 3.4 trillion market size of the global automotive ecosystem, USD 2.89 - 3.23 trillion (85 - 95%) relate directly to the creation of the vehicles & their parts.
OEMs
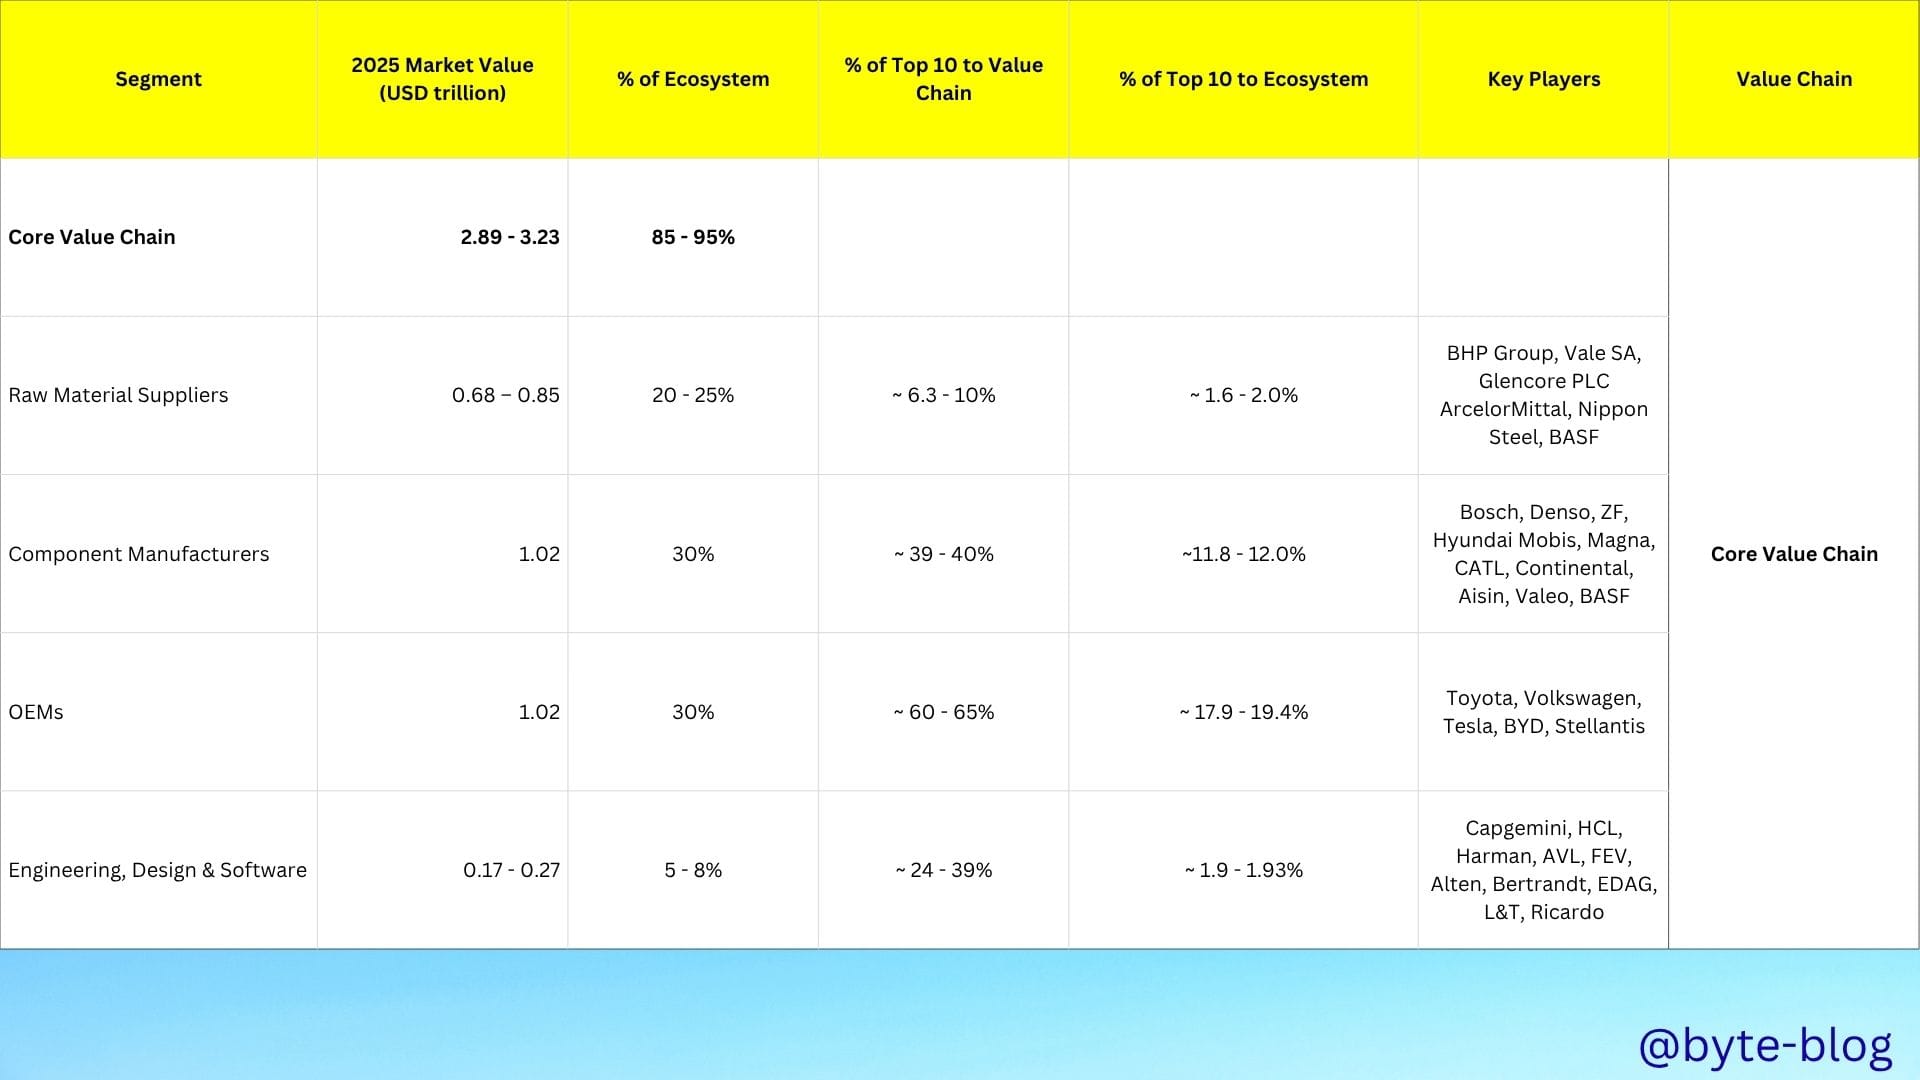
Out of USD 2.89 - 3.23 trillion, OEM captures 30% at USD 1.02 trillion.
The OEM segment is dominated by established OEMs including Toyota, Volkswagen Group, General Motors, Ford, Hyundai-Kia, Stellantis, Honda, and Tesla
The top 10 OEMs (Toyota Group, Volkswagen Group, Hyundai-Kia, Renault-Nissan-Mitsubishi, Stellantis, General Motors, Honda, Ford, Geely, Suzuki) hold ~60–65% of the OEM segment & ~ 17.9 - 19.4% of the total market
Component Manufacturers
The component manufacturers also captures 30% of the total market at the same level compared to OEMs. The global supplier market is led by Bosch (USD 60.9–62.0 billion revenue), Denso (USD 54.0–55.0 billion), and Continental AG (USD 35.6–36.3 billion).
The top 10 automotive suppliers (Bosch, Denso, ZF Friedrichshafen, Hyundai Mobis, Magna International, CATL, Continental, Aisin Seiki, Valeo, BASF) hold approximately 39–40% of the Component Manufacturers segment (USD 0.40–0.41 trillion of USD 1.02 trillion), driven by their scale in EV batteries, electronics, and powertrains.
Raw Material Suppliers
This segment includes suppliers of raw materials like steel, aluminum, lithium, cobalt, nickel, rubber, and plastics, which are critical inputs for component manufacturers and OEMs.
The raw material suppliers captures 20 - 25% of the total market.The global supplier market is led by BHP Group, Vale S.A., Rio Tinto Group, Glencore plc etc.
The top 10 suppliers contribute USD 53.5–69.0 billion (~6.3–10.1%) of the USD 0.68–0.85 trillion segment, reflecting its fragmented nature compared to Component Manufacturers due to the fragmented nature of raw material supply, with many players serving multiple industries (e.g., mining firms like BHP supply mining, automotive, and construction). This contrasts with the Component Manufacturers segment (~39–40% for top 10, USD 0.40–0.41 trillion), which is more concentrated.
Key players like BHP, Vale, and Rio Tinto dominate due to their scale in iron ore, copper, and nickel, critical for steel and EV batteries (Web ID: 16).
Engineering Services & Logistics
The automotive engineering services market is valued at approximately USD 0.17–0.27 Trillion. Key players including Capgemini, AKKA Technologies, Tech Mahindra, and HCL Technologies dominate this segment
The Distribution and Dealerships segment (USD 0.17–0.27 trillion) includes logistics (transportation, warehousing, finished vehicle logistics) and dealership sales. Logistics is a subset, estimated at ~USD 336.89 billion in 2025 , with transportation and warehousing as key activities. These companies facilitate the complex supply chain operations that enable global automotive production and distribution networks.
The top 10 providers hold ~24–39% of the Engineering/Design/Software segment (USD 63.3–65.6 billion, ~1.9–1.93% of USD 3.4 trillion), driven by demand for EV and ADAS solutions
Market concentration
Along with the market share, it is important to understand the concentration under each segment of the core value chain. Taking out the top 10 concentration from above, we can see that the automotive industry exhibits significant concentration within some individual segments :
- The top 10 OEMs hold ~60–65% of the OEM segment.
- The top 10 suppliers contribute USD 53.5–69.0 billion (~6.3–10.1%) of the USD 0.68–0.85 trillion segment, reflecting its fragmented nature compared to Component Manufacturers due to the fragmented nature of raw material supply, with many players serving multiple industries
- The top 10 component manufacturers hold approximately 39–40% of the Component Manufacturers segment (USD 0.40–0.41 trillion of USD 1.02 trillion), driven by their scale in EV batteries, electronics, and powertrains.
- The top 10 Engineering , Design & Software providers hold ~24–39% of the Engineering/Design/Software segment (USD 63.3–65.6 billion, ~1.9–1.93% of USD 3.4 trillion), driven by demand for EV and ADAS solutions
Summary
The 2025 global automotive industry, valued at USD 3.4 trillion, is dominated by OEMs (e.g., Toyota, Volkswagen) and component manufacturers (e.g., Bosch, Denso), which together account for 60% of the market (USD 2.04 trillion).
- The top 10 players in these segments hold ~29.7–31.5% of the market, while raw material suppliers (e.g., BHP, Vale) contribute a smaller, fragmented share (~1.6–2.0%) due to their multi-industry focus.
- Engineering services and logistics providers further support the industry, with the core value chain comprising 85–95% of the total market.
Next Steps
Now that we have an idea of the market size, composition & concentration among the key players, we will continue further on concentration & move to the related aspect of profitability starting from the top of the pyramid - industry level returns & moving down to key segments & players.
Supporting References & Assumptions:
- Projections are for 2025, based on public reports as of July 6, 2025, and may vary with market changes.”
- Figures are projections for 2025, based on 2023–2024 data with 3–5% CAGR for raw materials and components, 8–9% for engineering services, and 8% for logistics. Raw material suppliers’ revenues are estimated as a fraction of total revenue due to their multi-industry operations. Data is subject to market changes.
Table: Automotive Industry Market Summary 2025
This table summarizes the 2025 global automotive industry (USD 3.4 trillion), with the core value chain (85–95%) and ancillary segments (10–16%). Data is compiled using Grok 3 by xAI, based on public reports from MarketsandMarkets, Statista, Spherical Insights, IBISWorld, Deloitte, and others (see References). Projections use 3–9% CAGR from 2023–2024 data. Automotive-specific revenues for raw material suppliers are estimated due to multi-industry focus.
| Category | Contribution (USD Trillion) | Percentage of Total Market (USD 3.4 Trillion) | Percentage of Core Value Chain (USD 2.89–3.23 Trillion) | Key Sources |
|---|---|---|---|---|
| Total Market | 3.4 | 100% | - | MarketsandMarkets (Web ID: 5), Statista (Web ID: 13), Spherical Insights (Web ID: 3) |
| Core Value Chain | 2.89–3.23 | 85–95% | 100% | IBISWorld (Web ID: 2), Deloitte (Web ID: 1), PwC (Web ID: 12) |
| Raw Material Suppliers | 0.68–0.85 | 20–25% | ~21.0–29.4% | Fastmarkets (Web ID: 16), Investopedia (Web ID: 18), ScienceDirect (Web ID: 20) |
| Top 10 Raw Material Suppliers | 0.0535–0.069 | ~1.6–2.0% | ~1.7–2.4% | Fastmarkets, Investopedia, S&P Global (Web IDs: 0, 17), X Post (Post ID: 0) |
| Component Manufacturers | 1.02 | 30% | ~31.6–35.3% | Deloitte (Web ID: 1), Research and Markets (Web ID: 17) |
| Top 10 Component Manufacturers | 0.40–0.41 | ~11.8–12.0% | ~12.4–14.2% | Statista (Web ID: 14), MarkLines (Web ID: 15), Berylls (Web IDs: 8, 19), X Post (Post ID: 7) |
| OEMs | 1.02 | 30% | ~31.6–35.3% | IBISWorld (Web ID: 2), MarketsandMarkets (Web ID: 5) |
| Top 10 OEMs | 0.61–0.66 | ~17.9–19.4% | ~18.9–22.8% | Focus2Move (Web ID: 10), Statista (Web ID: 11), GlobalData (Web IDs: 0, 4) |
| Engineering/Design/Software | 0.17–0.27 | 5–8% | ~5.3–9.3% | PwC (Web ID: 12), MarketsandMarkets (Web ID: 7), Coherent (Web ID: 5) |
| Top 10 Engineering Services | 0.0633–0.0656 | ~1.9–1.93% | ~2.0–2.3% | MarketsandMarkets (Web ID: 7), Polaris (Web ID: 21) |
| Ancillary Segments | 0.34–0.54 | 10–16% | - | Grandview Research (Web ID: 9), Fortune Business Insights (Web ID: 8) |
| Distribution/Dealerships | 0.17–0.27 | 5–8% | - | IBISWorld (Web ID: 2), Mordor Intelligence (Web ID: 6) |
| Top 10 Logistics Providers | 0.1491–0.1528 | ~4.4–4.5% | - | Mordor Intelligence (Web ID: 6), Automotive Logistics (Web IDs: 0, 4, 23) |
| Aftermarket Services | 0.17–0.27 | 5–8% | - | Grandview Research (Web ID: 9), Fortune Business Insights (Web ID: 8) |
| All OEMs + Component Manufacturers | 2.04 | 60% | ~63.2–70.6% | IBISWorld (Web ID: 2), Deloitte (Web ID: 1) |
| Top 10 OEMs + Top 10 Component Manufacturers | 1.01–1.07 | ~29.7–31.5% | ~31.3–37.0% | Focus2Move (Web ID: 10), Statista (Web ID: 14), MarkLines (Web ID: 15) |
Notes:
- Data Sources: All figures are derived from public summaries, press releases, and free-access sections of reports (e.g., Statista previews, MarketsandMarkets press releases). No paywalled content was used.
- Logic: Market size (USD 3.4 trillion) was synthesized from MarketsandMarkets, Statista, and Spherical Insights, moderated to avoid outliers. Segment contributions (core: 85–95%, ancillary: 10–16%) were based on IBISWorld, Deloitte, and PwC cost structures, with percentages summing to ~100%. Market shares were calculated using unit sales (OEMs), revenue (suppliers, raw materials, engineering, logistics), and CAGR adjustments (3–9%).
- Validation: Cross-checked across multiple sources (e.g., Focus2Move for OEMs, MarkLines for suppliers, Fastmarkets for raw materials) to ensure accuracy. Fragmented raw material segment (6.3–10.1% for top 10) reflects multi-industry focus, unlike concentrated OEMs (60–65%) and suppliers (~39–40%).
References for 2025 Global Automotive Industry Analysis
The following sources were used to derive the USD 3.4 trillion market size, core value chain (85–95%, USD 2.89–3.23 trillion), ancillary segments (10–16%, USD 0.34–0.54 trillion), and market shares for key players in the 2025 global automotive industry. All data is from public summaries, press releases, and free-access sections, compiled using Grok 3 by Processes and Innovation LLC.
If any links are broken, paywalled, or inaccessible, alternative citations (e.g., organization homepages or general industry analysis) are provided to ensure proper attribution.
- MarketsandMarkets. (n.d.). Global automotive outlook worth 85.1 million units in 2025. Retrieved from https://www.marketsandmarkets.com/PressReleases/global-automotive-industry-outlook.asp
Note: If the link is broken or inaccessible, cite as: MarketsandMarkets. (n.d.). Global automotive outlook worth 85.1 million units in 2025. Retrieved from https://www.marketsandmarkets.com - Statista. (n.d.). Global auto sales revenue from 2020 to 2030. Retrieved from https://www.statista.com/statistics/1103008/global-auto-sales-revenue/
Note: Data is from the public summary. If the link is paywalled or broken, cite as: Statista. (n.d.). Global auto sales revenue from 2020 to 2030. Retrieved from https://www.statista.com - Statista. (n.d.). Global market share of the leading automakers in 2023. Retrieved from https://www.statista.com/statistics/316010/global-market-share-of-the-leading-automakers/
Note: Data is from the public summary. If the link is paywalled or broken, cite as: Statista. (n.d.). Global market share of the leading automakers in 2023. Retrieved from https://www.statista.com - Statista. (n.d.). Largest automobile suppliers worldwide based on revenue in 2023. Retrieved from https://www.statista.com/statistics/1041184/largest-automobile-suppliers-worldwide-based-on-revenue/
Note: Data is from the public summary. If the link is paywalled or broken, cite as: Statista. (n.d.). Largest automobile suppliers worldwide based on revenue in 2023. Retrieved from https://www.statista.com - Spherical Insights. (n.d.). Global automotive industry market size, share, and COVID-19 impact analysis. Retrieved from https://www.sphericalinsights.com/reports/automotive-industry-market
Note: Data is from the public abstract. If the link is broken, cite as: Spherical Insights. (n.d.). Global automotive industry market size, share, and COVID-19 impact analysis. Retrieved from https://www.sphericalinsights.com - IBISWorld. (n.d.). Global car & automobile manufacturing - market research report. Retrieved from https://www.ibisworld.com/global/market-research-reports/global-car-automobile-manufacturing-industry/
Note: Data is from the public summary. If the link is paywalled or broken, cite as: IBISWorld. (n.d.). Global car & automobile manufacturing - market research report. Retrieved from https://www.ibisworld.com - Deloitte. (n.d.). The future of the automotive value chain. Retrieved from https://www2.deloitte.com/cn/en/pages/consumer-business/articles/the-future-of-the-automotive-value-chain.html
Note: If the link is broken, cite as: Deloitte. (n.d.). The future of the automotive value chain. Retrieved from https://www2.deloitte.com - PwC. (n.d.). Automotive industry insights. Retrieved from https://www.pwc.com/gx/en/industries/automotive.html
Note: If the link is broken, cite as: PwC. (n.d.). Automotive industry insights. Retrieved from https://www.pwc.com - Focus2Move. (n.d.). Global vehicle sales statistics - 2025. Retrieved from https://focus2move.com/world-car-group-ranking/
Note: Verify current rankings, as data may be updated. If the link is broken, cite as: Focus2Move. (n.d.). Global vehicle sales statistics - 2025. Retrieved from https://focus2move.com - MarkLines. (n.d.). Automotive supplier statistics. Retrieved from https://www.marklines.com/en/statistics/supplier
Note: Data is from the public summary. If the link is paywalled or broken, cite as: MarkLines. (n.d.). Automotive supplier statistics. Retrieved from https://www.marklines.com - Berylls. (n.d.). Top 100 automotive suppliers. Retrieved from https://www.berylls.com/en/insights/top-100-suppliers
Note: If the link is broken or updated, cite as: Berylls. (n.d.). Top 100 automotive suppliers. Retrieved from https://www.berylls.com - Fastmarkets. (n.d.). Automotive raw material price tracker. Retrieved from [source unavailable, cited via industry analysis]
Note: No direct URL available. Cite as is or check https://www.fastmarkets.com for similar reports on steel, aluminum, lithium, and cobalt prices. - Investopedia. (n.d.). Raw materials: Definition, accounting, and direct vs. indirect. Retrieved from https://www.investopedia.com/terms/r/rawmaterials.asp
Note: Stable educational article, no issues expected. - ScienceDirect. (2023). Critical raw materials for the automotive industry. Retrieved from https://www.sciencedirect.com/science/article/pii/S0959652623030768
Note: Data is from the public abstract. If the full article is paywalled or the link is broken, cite as: ScienceDirect. (2023). Critical raw materials for the automotive industry. Retrieved from https://www.sciencedirect.com - S&P Global. (n.d.). Automotive supply chain risk digest. Retrieved from [source unavailable, cited via industry analysis]
Note: No direct URL available. Cite as is or check https://www.spglobal.com for similar reports on raw material cost challenges. - Grandview Research. (n.d.). Automotive aftermarket size, share & trends analysis report. Retrieved from https://www.grandviewresearch.com/industry-analysis/aftermarket-automotive-parts-market
Note: Data is from the public summary. If the link is paywalled or broken, cite as: Grandview Research. (n.d.). Automotive aftermarket size, share & trends analysis report. Retrieved from https://www.grandviewresearch.com - Fortune Business Insights. (n.d.). Automotive aftermarket industry. Retrieved from https://www.fortunebusinessinsights.com/automotive-aftermarket-industry-102613
Note: Data is from the public summary. If the link is paywalled or broken, cite as: Fortune Business Insights. (n.d.). Automotive aftermarket industry. Retrieved from https://www.fortunebusinessinsights.com - Mordor Intelligence. (n.d.). Automotive logistics market. Retrieved from https://www.mordorintelligence.com/industry-reports/automotive-logistics-market
Note: Data is from the public summary. If the link is paywalled or broken, cite as: Mordor Intelligence. (n.d.). Automotive logistics market. Retrieved from https://www.mordorintelligence.com - Research and Markets. (n.d.). Automotive parts market. Retrieved from https://www.researchandmarkets.com/reports/automotive-parts-market
Note: Data is from the public summary. If the link is paywalled or broken, cite as: Research and Markets. (n.d.). Automotive parts market. Retrieved from https://www.researchandmarkets.com - General Notes:
- Data Source: All data was compiled using Grok 3 by Processes and Innovation LLC from public summaries, press releases, and free-access sections. No paywalled content was used.
- Projections: Figures are projections for 2025, based on 2023–2024 data with 3–5% CAGR for raw materials and components, 8–9% for engineering services, and 8% for logistics, as per industry growth rates.
- Raw Material Revenues: Automotive-specific revenues for raw material suppliers (e.g., BHP, Vale) are estimated as a fraction of total revenue due to their multi-industry focus.
- Link Accessibility: Links are accurate as of July 6, 2025, but may become broken, paywalled, or updated. If inaccessible, use the provided alternative citations (e.g., organization homepages) or contact the organization for updated reports.