Strategy Byte - Week 54 Industry Profitability

Table of Contents
- Recap
- Industry Profitability
- EBIT / Operating Margin
- Industry Numbers
- Historical Perspective
- Value Chain Breakup
Recap
From Week 49, we started our exploration of industry analysis with the automotive industry.
We started with industry segmentation to understand how the industry is structured. We focused on vehicle type based segmentation as below:
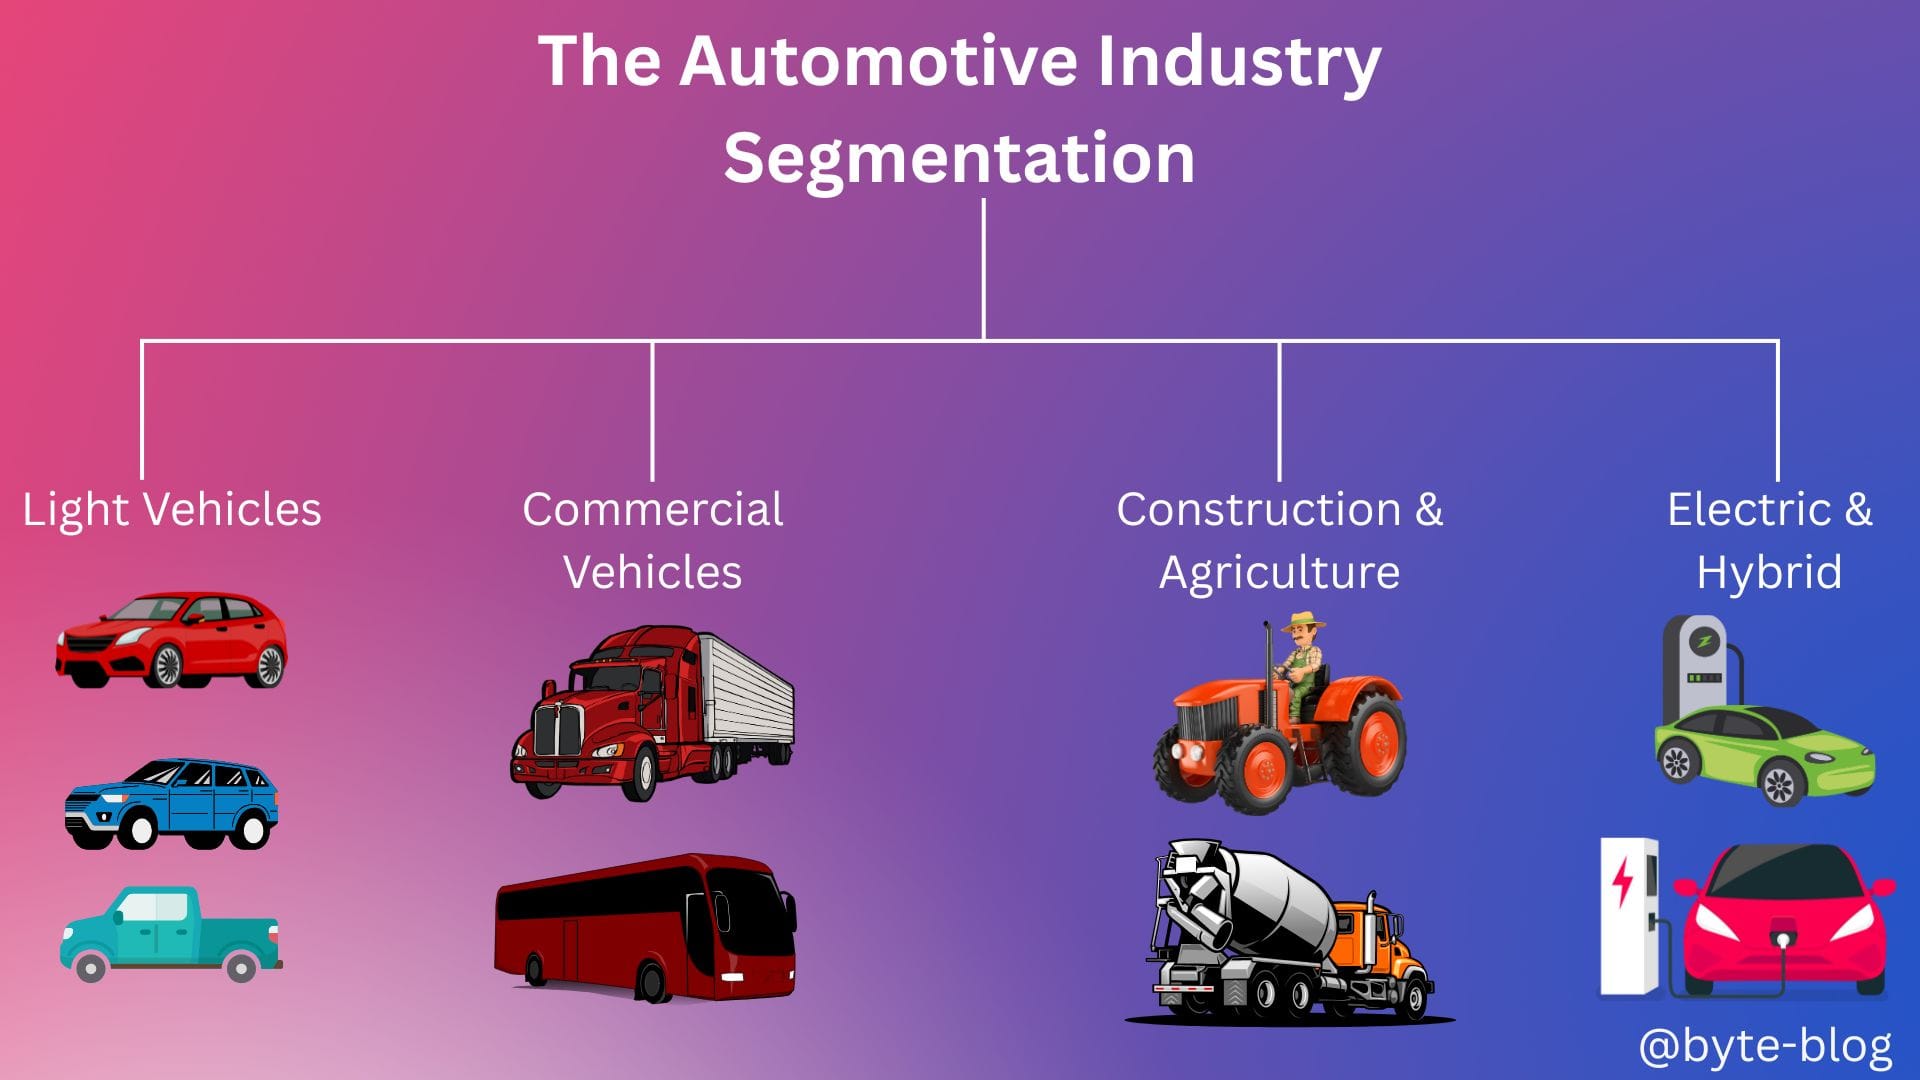
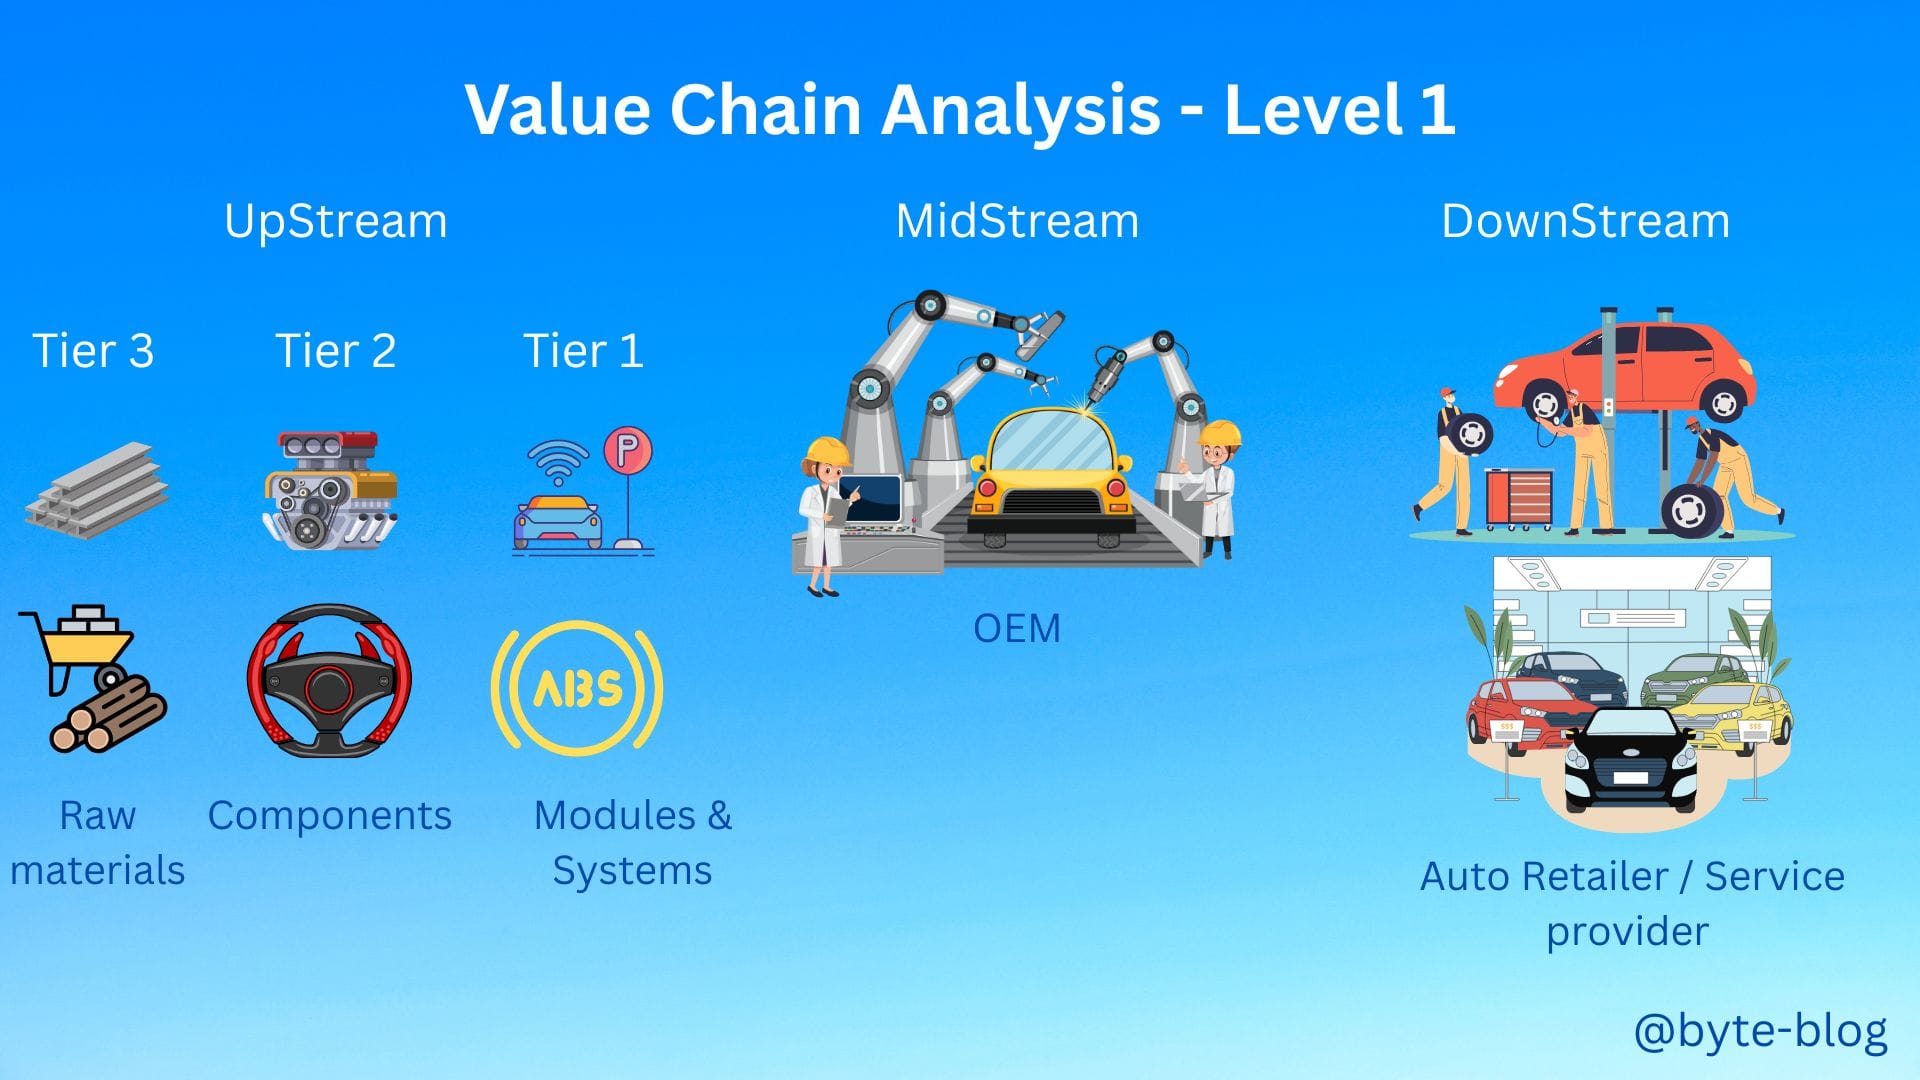
Then we did a value chain analysis. To recap, the value chain covers all the activities from conception of the product (automobile) till the final delivery to the customer with each activity adding value at different stages.
We analyzed the value chain at two levels for ease of understanding
Level -1 : Higher Level
We categorized the value chain into :
- Upstream segment - includes
- Raw material suppliers (Tier 3)
- Component Manufacturers (Tier 2)
- System Suppliers (Tier 1)
- Midstream segment - dominated by OEMs who design, manufacture & assemble vehicles
- Downstream segment - Comprises dealership network & after-sales services
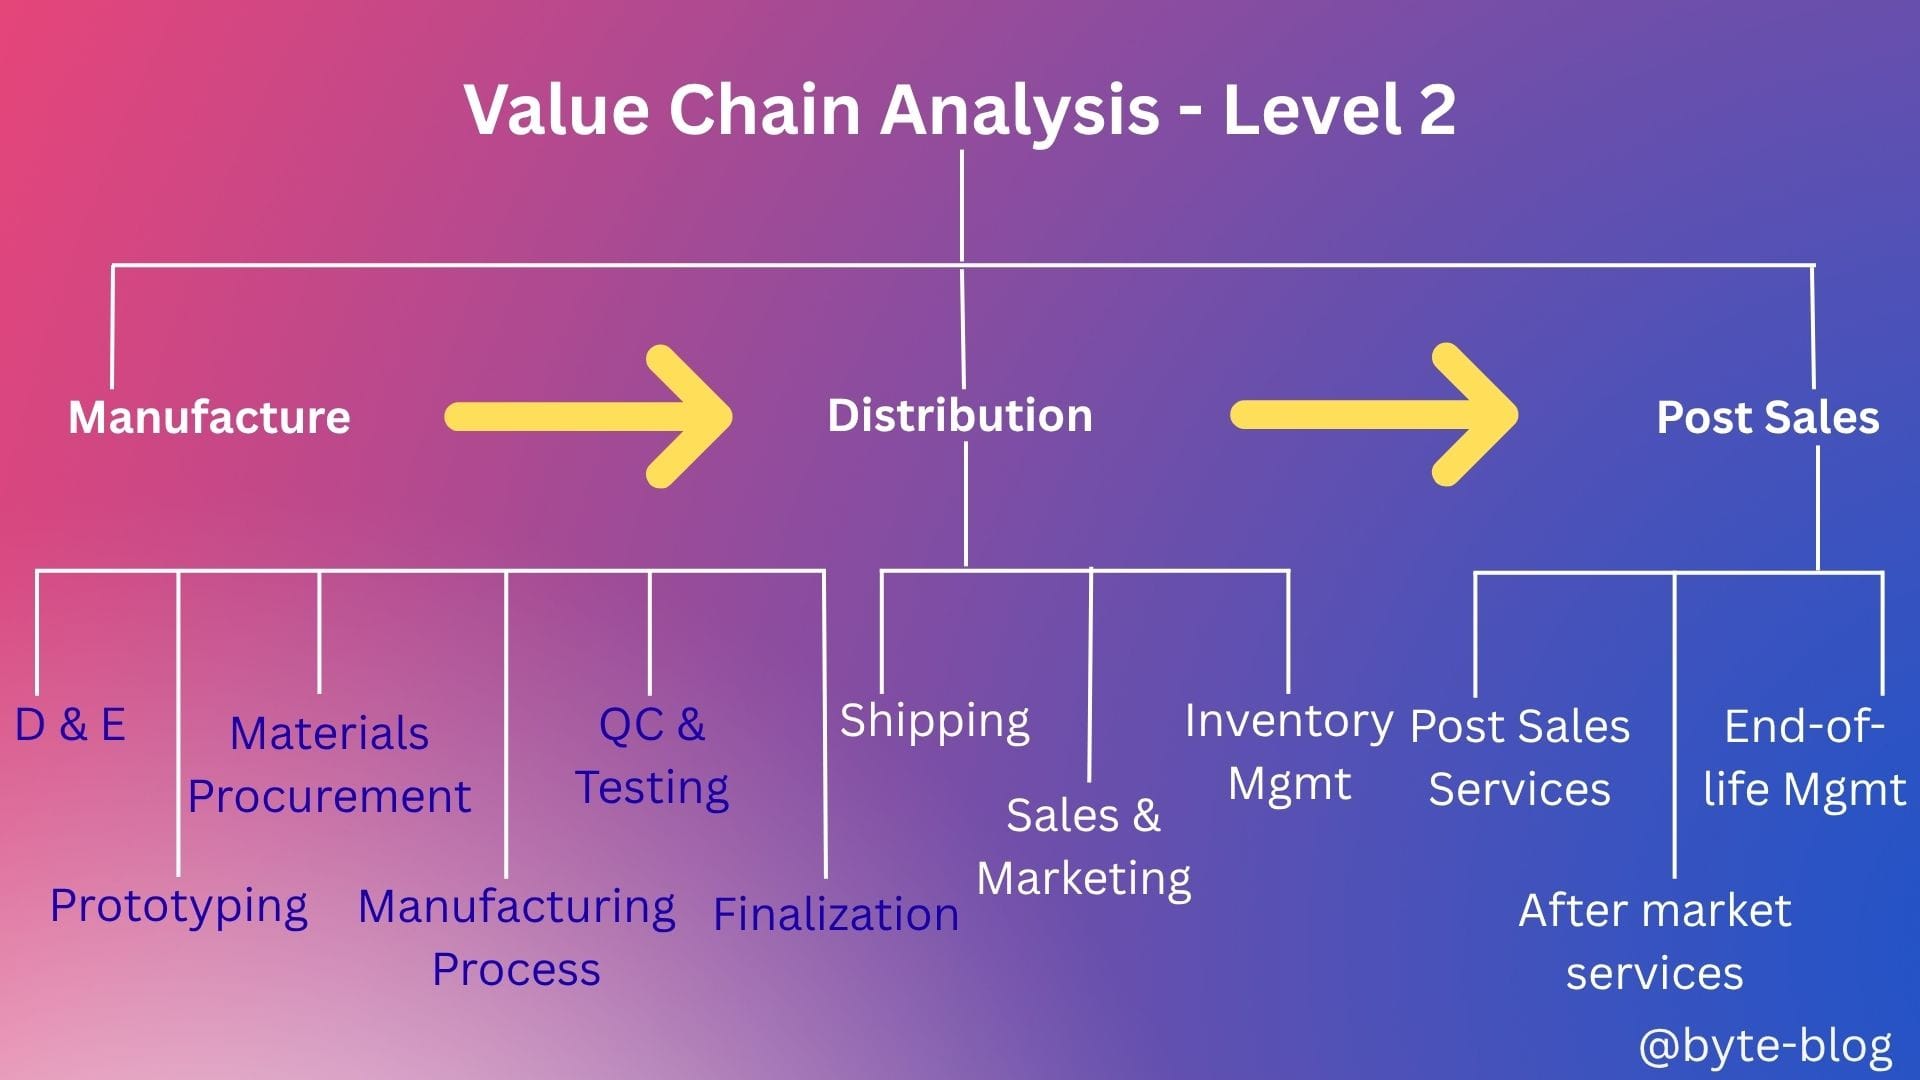
Level - 2 : Lower Level
We further broke the end-to-end processes from concept to sale of an automobile & after-sales services as below:
- Manufacture
- Distribution &
- Post Sales
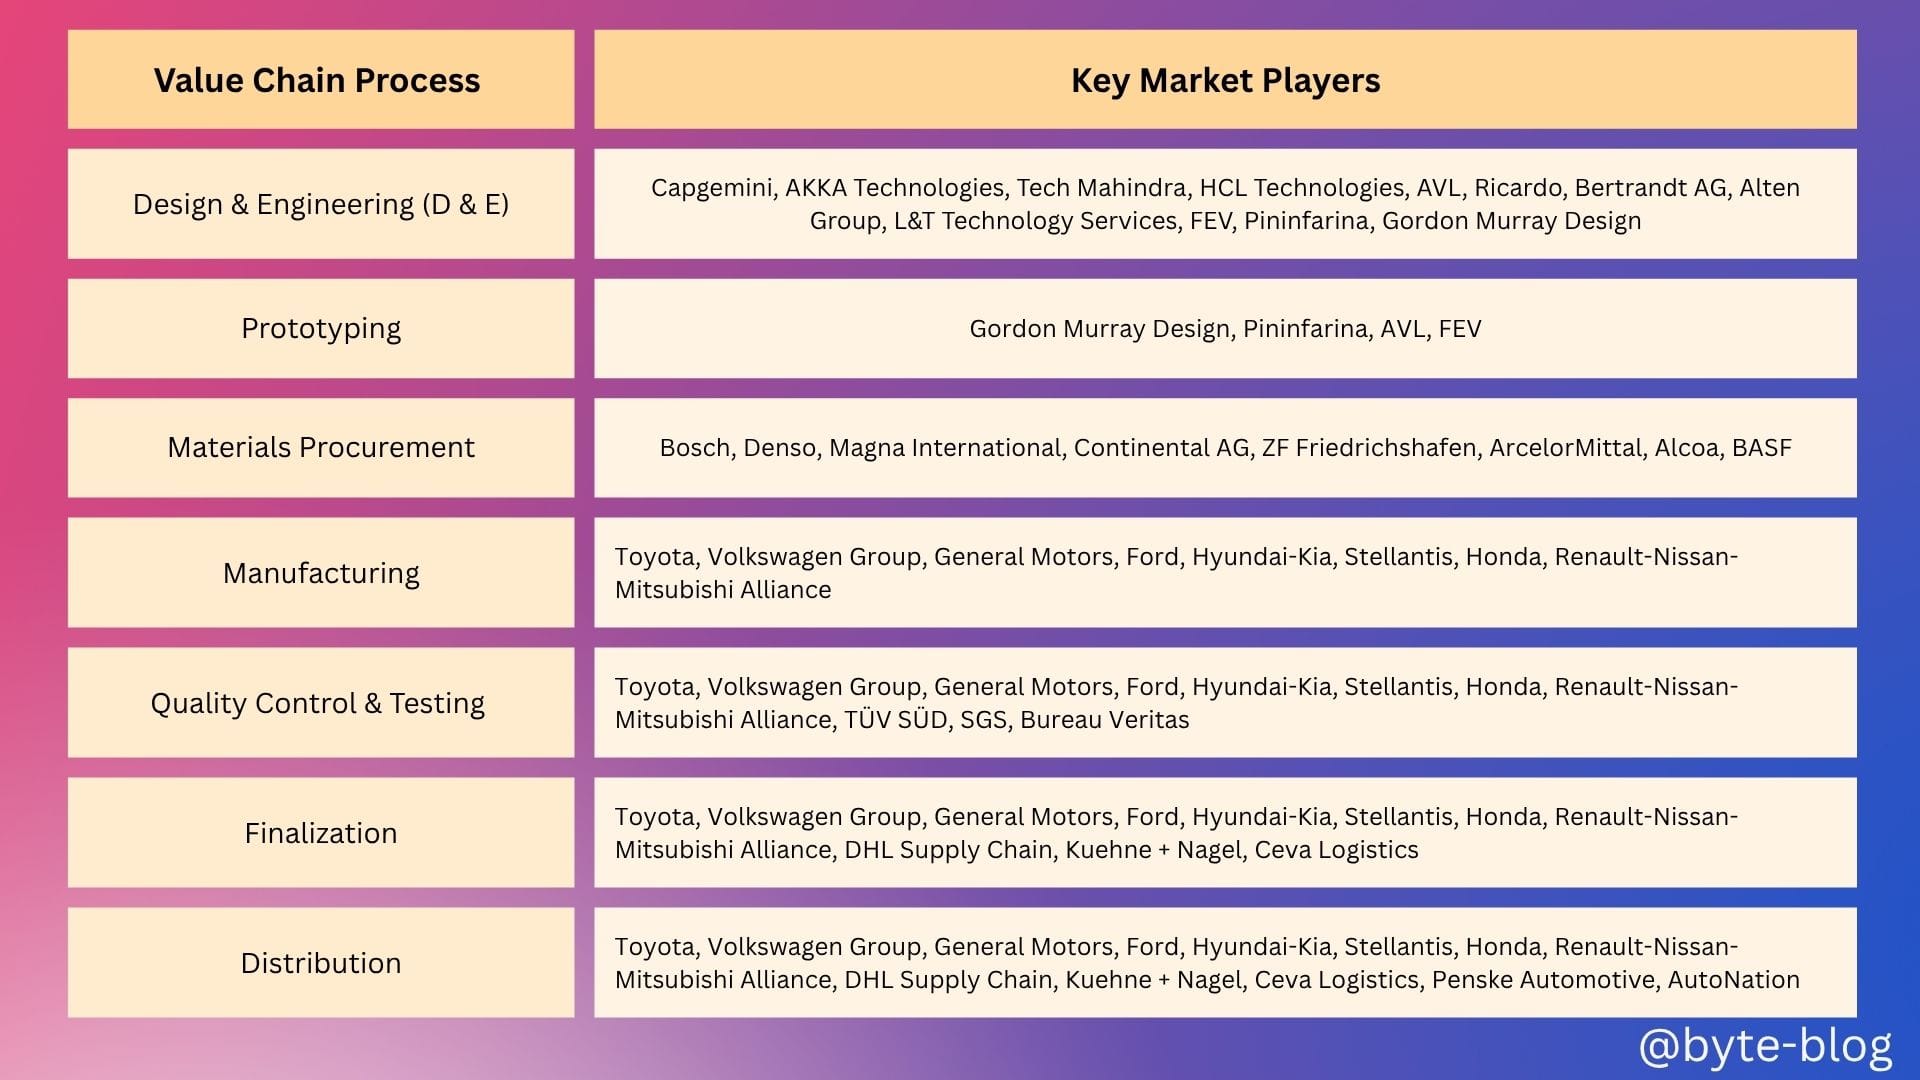
Then we identified the key players under each value chain as visualized below:
Then we got into numbers by starting at the top of the pyramid with the total market size & dividing it into :
- Core Value Chain &
- Ancillary Segments
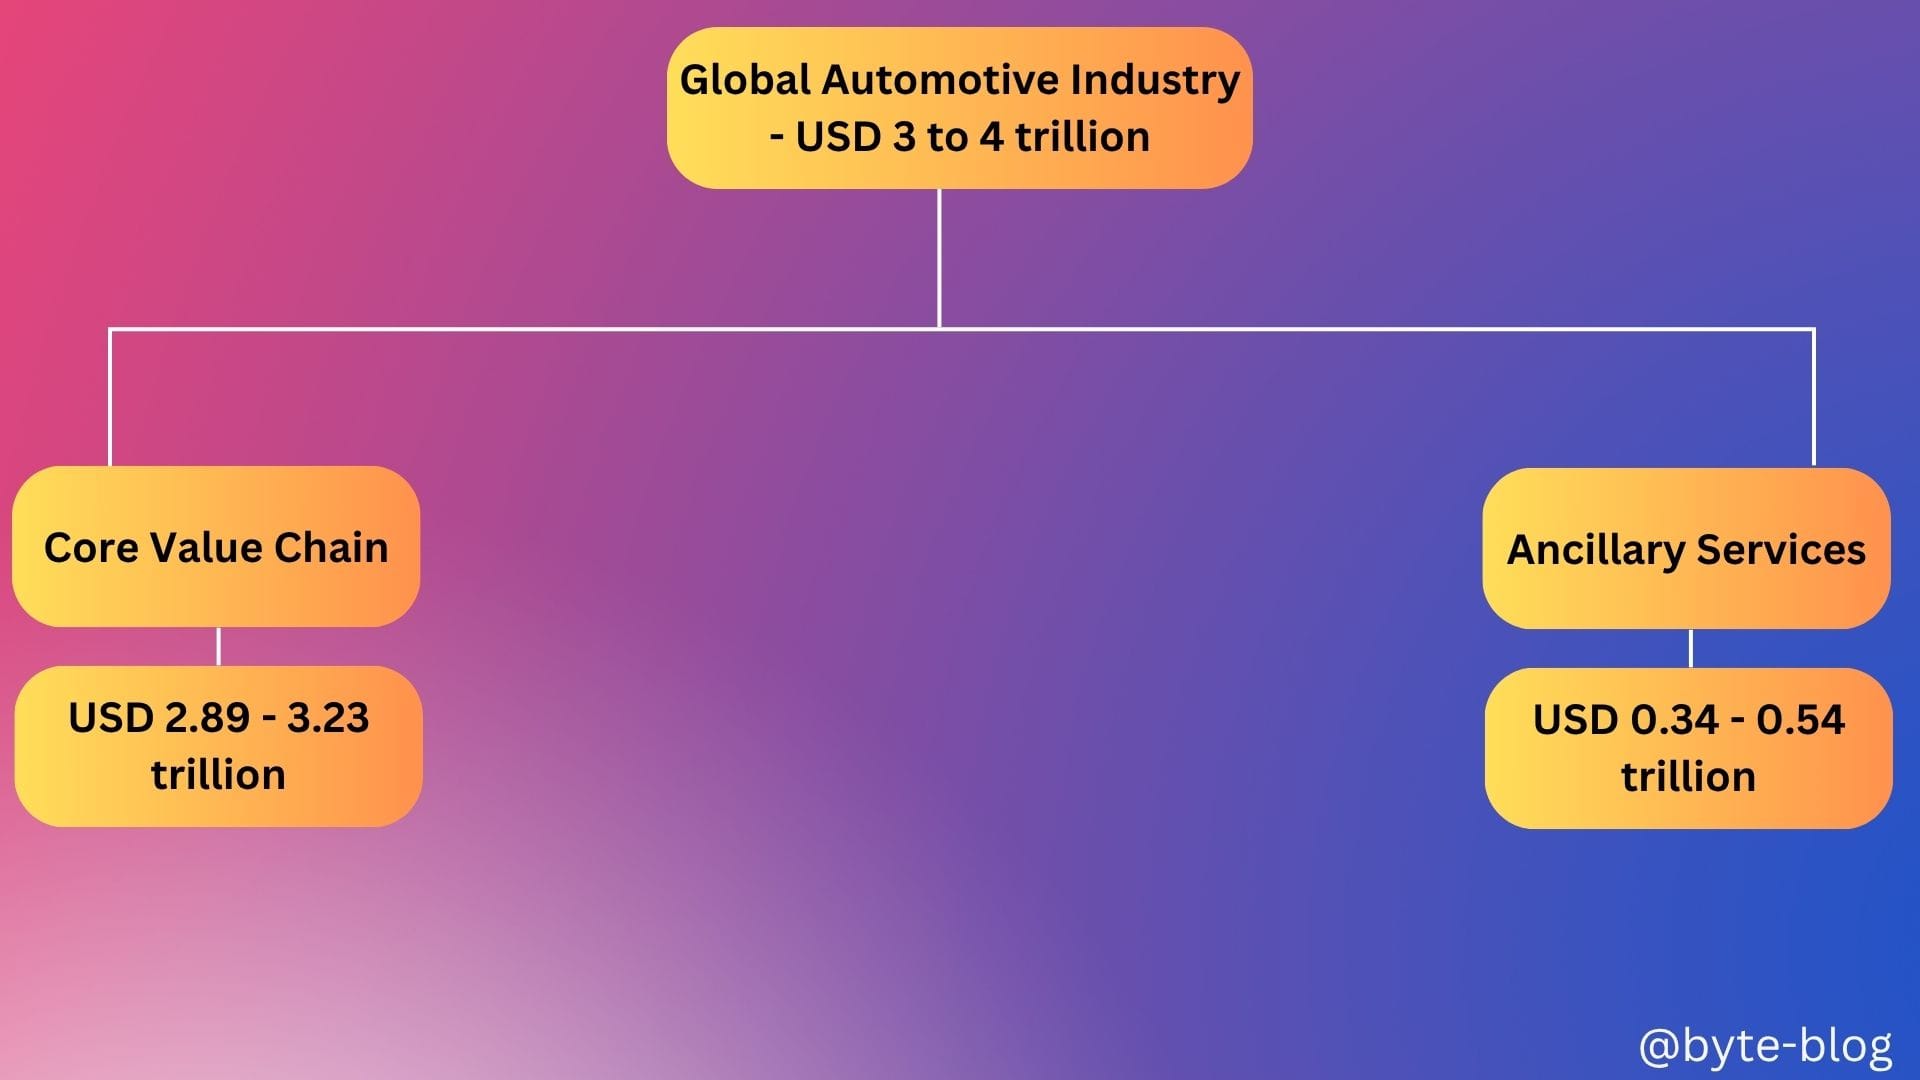
We then dug deeper to identify the market share of key players in the value chain.
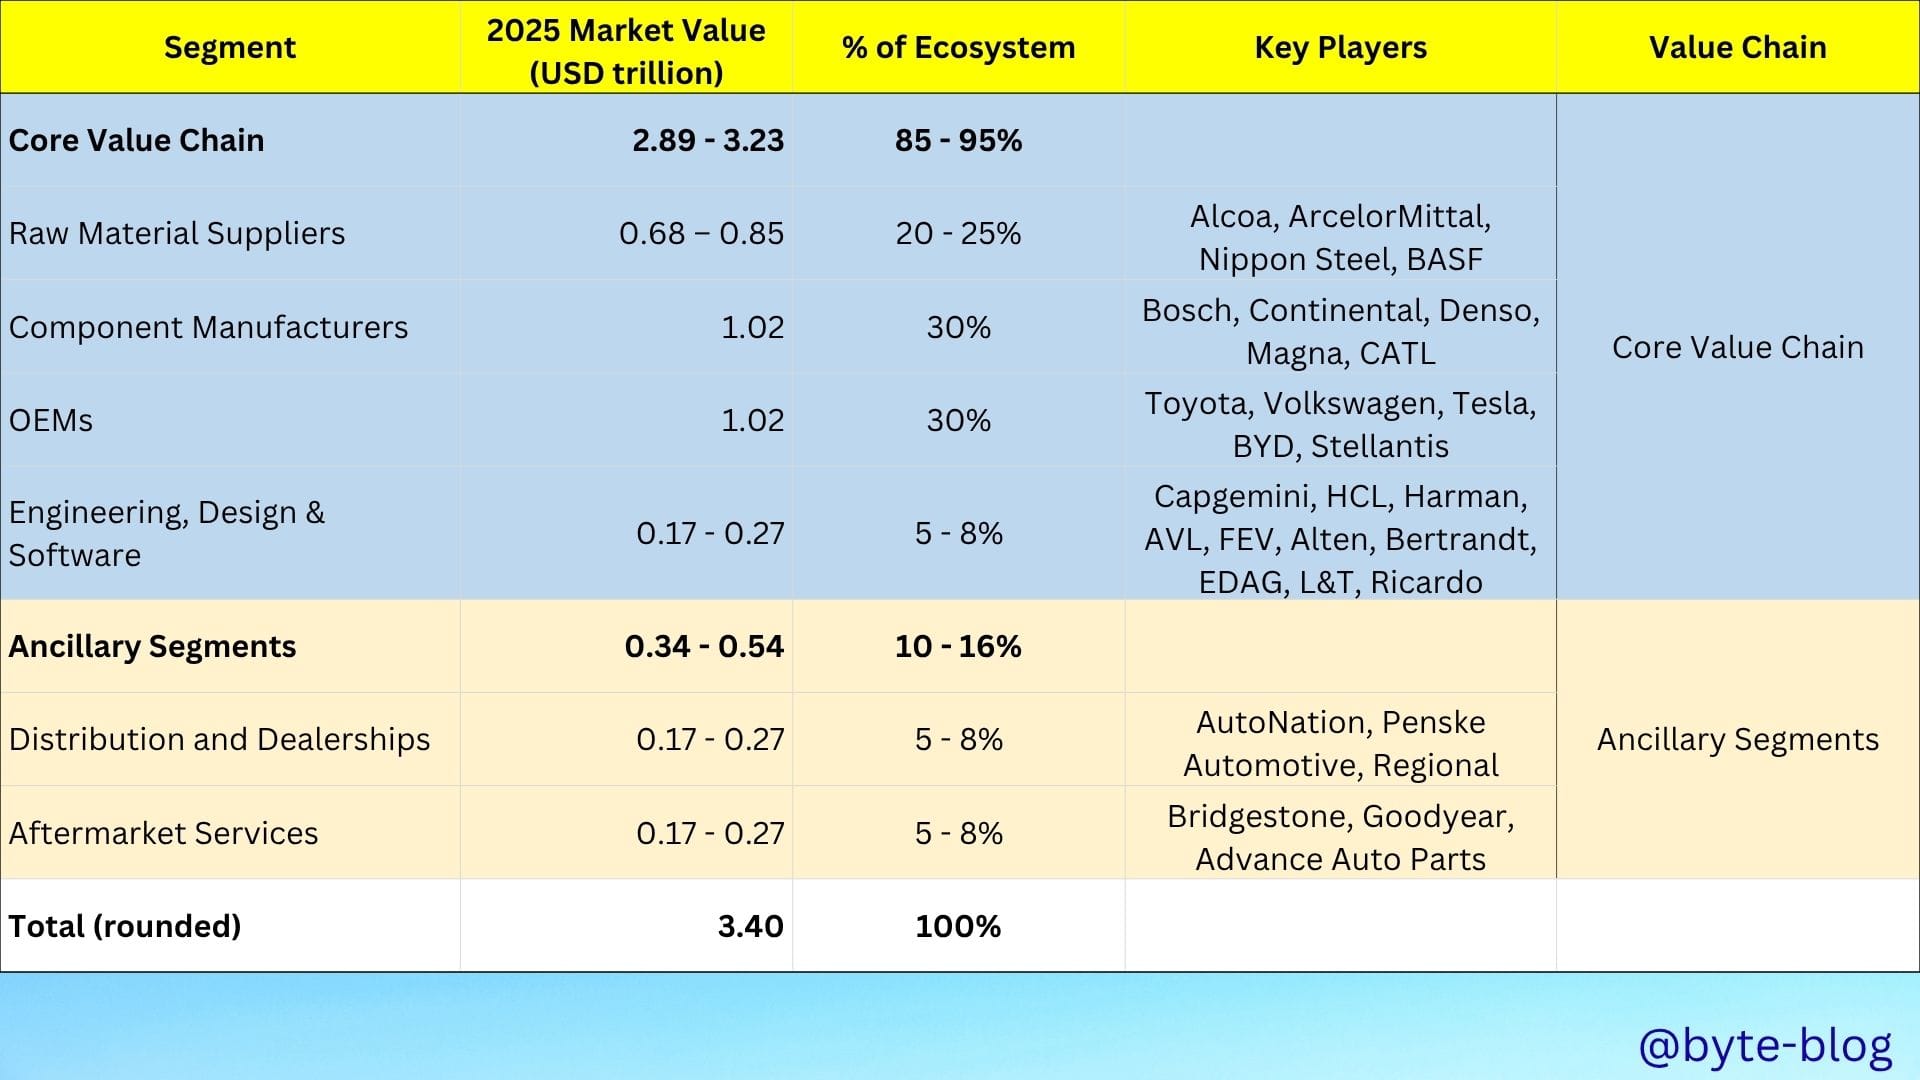
We focused our discussion around concentration with the below summary :
- The top 10 OEMs hold ~60–65% of the OEM segment.
- The top 10 suppliers contribute USD 53.5–69.0 billion (~6.3–10.1%) of the USD 0.68–0.85 trillion segment, reflecting its fragmented nature compared to Component Manufacturers due to the fragmented nature of raw material supply, with many players serving multiple industries
- The top 10 component manufacturers hold approximately 39–40% of the Component Manufacturers segment (USD 0.40–0.41 trillion of USD 1.02 trillion), driven by their scale in EV batteries, electronics, and powertrains.
- The top 10 Engineering , Design & Software providers hold ~24–39% of the Engineering/Design/Software segment (USD 63.3–65.6 billion, ~1.9–1.93% of USD 3.4 trillion), driven by demand for EV and ADAS solutions
Why concentration? This is because
- Concentration in an industry shows the level of competition &
- How it impacts profitability of the players within the industry. How?
Different industries have different profitability levels because of structural differences in :
- Competitive Dynamics
- Cost Structure &
- Market characteristics
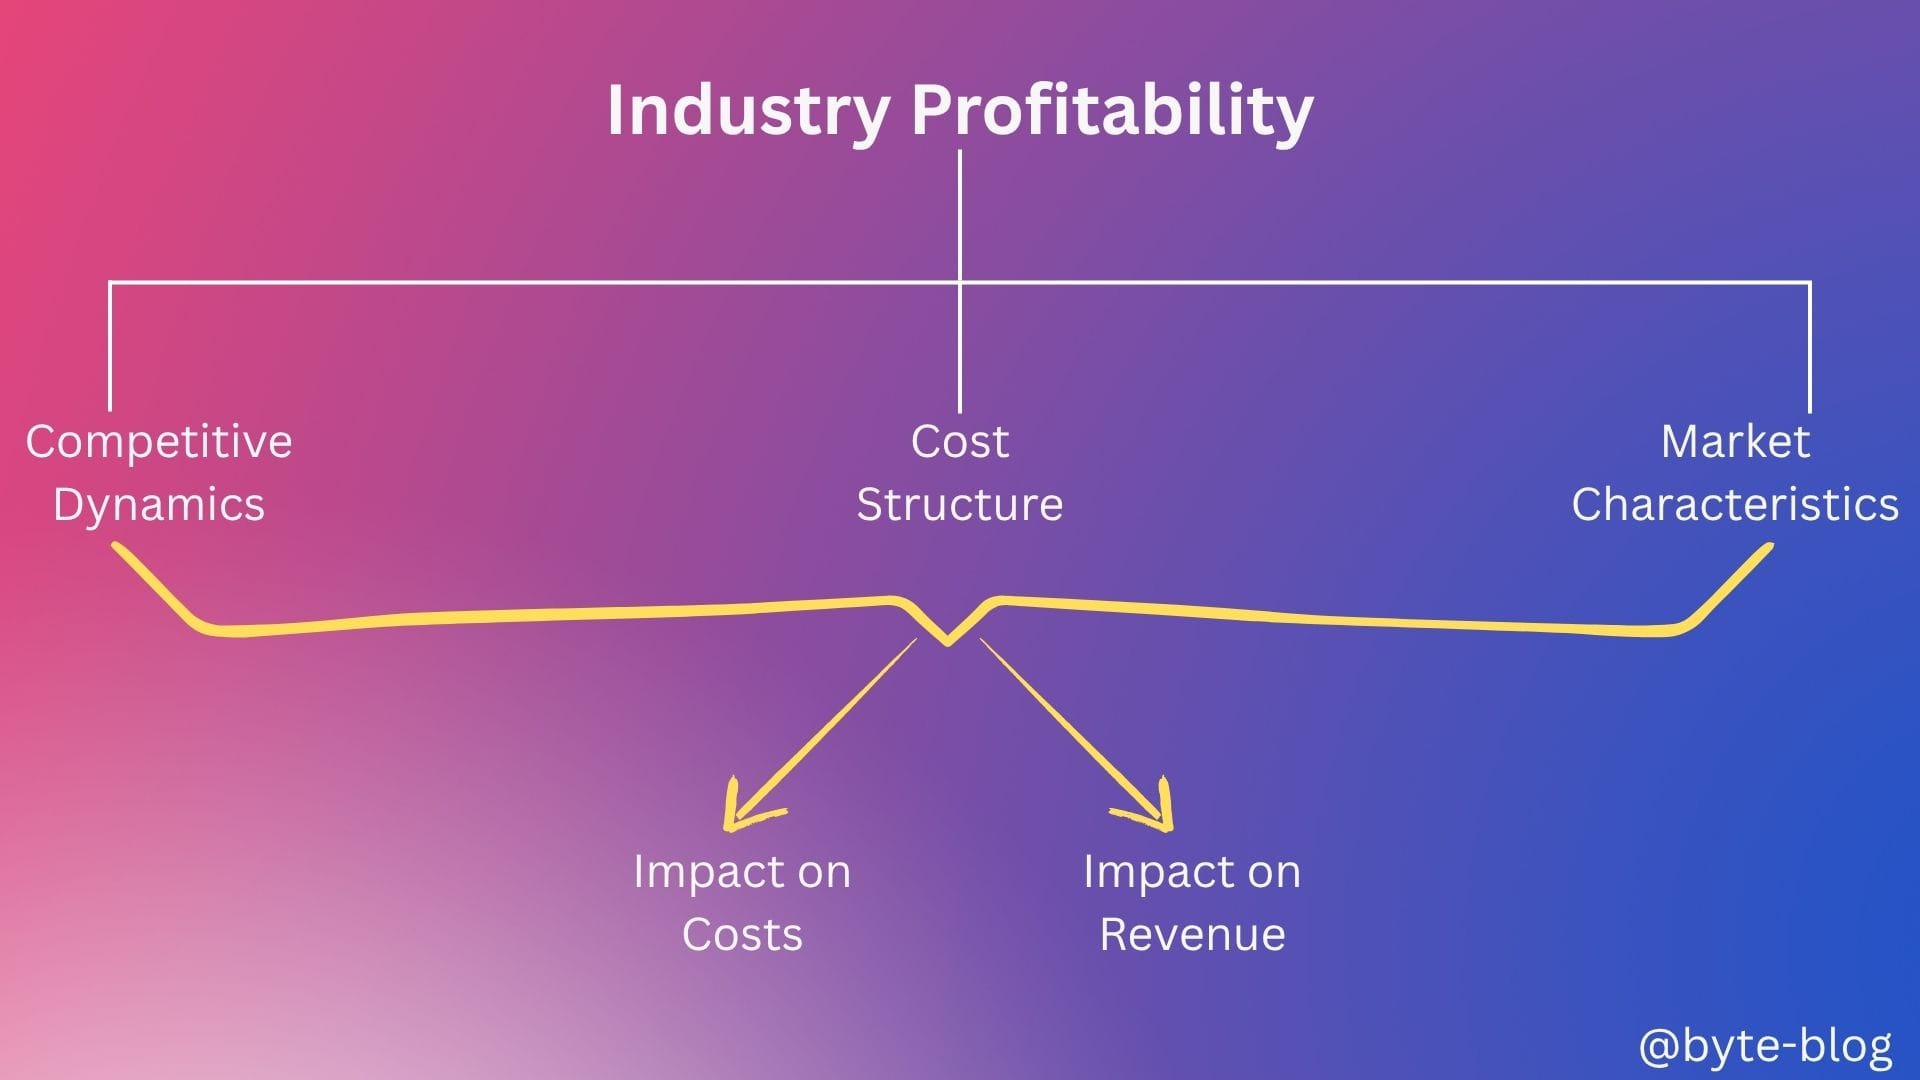
There are substantial differences in profitability levels across industries due to the differences in the above three factors by industry & their impact on cost or revenue ultimately impacting profits.
For ease of discussion, we divided the industries into :
- High Profitability Industries - for e.g., software & technology, financial services, healthcare & pharmaceuticals etc
- Low Profitability Industries - for e.g., Airlines, OEMs, retail (grocery) etc
Now, you might have a question - Why do I keep repeating the keys points every week? It's for context & a summary review.
Let us move forward to see whether the players within the automotive sector are making money or not by analyzing the profitability of the industry & it's key players along with understanding the factors that influence profitability.
Industry Profitability
EBIT / Operating Margin
For Profitability, we will use the EBIT (Earnings Before Interest & Tax) margin or operating profit margin. But first, what is EBIT or Operating profit?
Operating Profit is calculated by subtracting Cost of Goods Sold (COGS), depreciation & amortization, & all relevant operating expenses from total Revenues. Operating expenses include a company's expenses beyond direct production costs such as salaries & benefits, rent & related overhead expenses, R & D costs etc. (Source : here)
The EBIT or Operating profit margin is calculated by dividing operating profit by Total Revenue which shows the percentage of operating profit derived from the total revenue.
Operating Margin (%) = (Operating Profit / Total Revenue) * 100
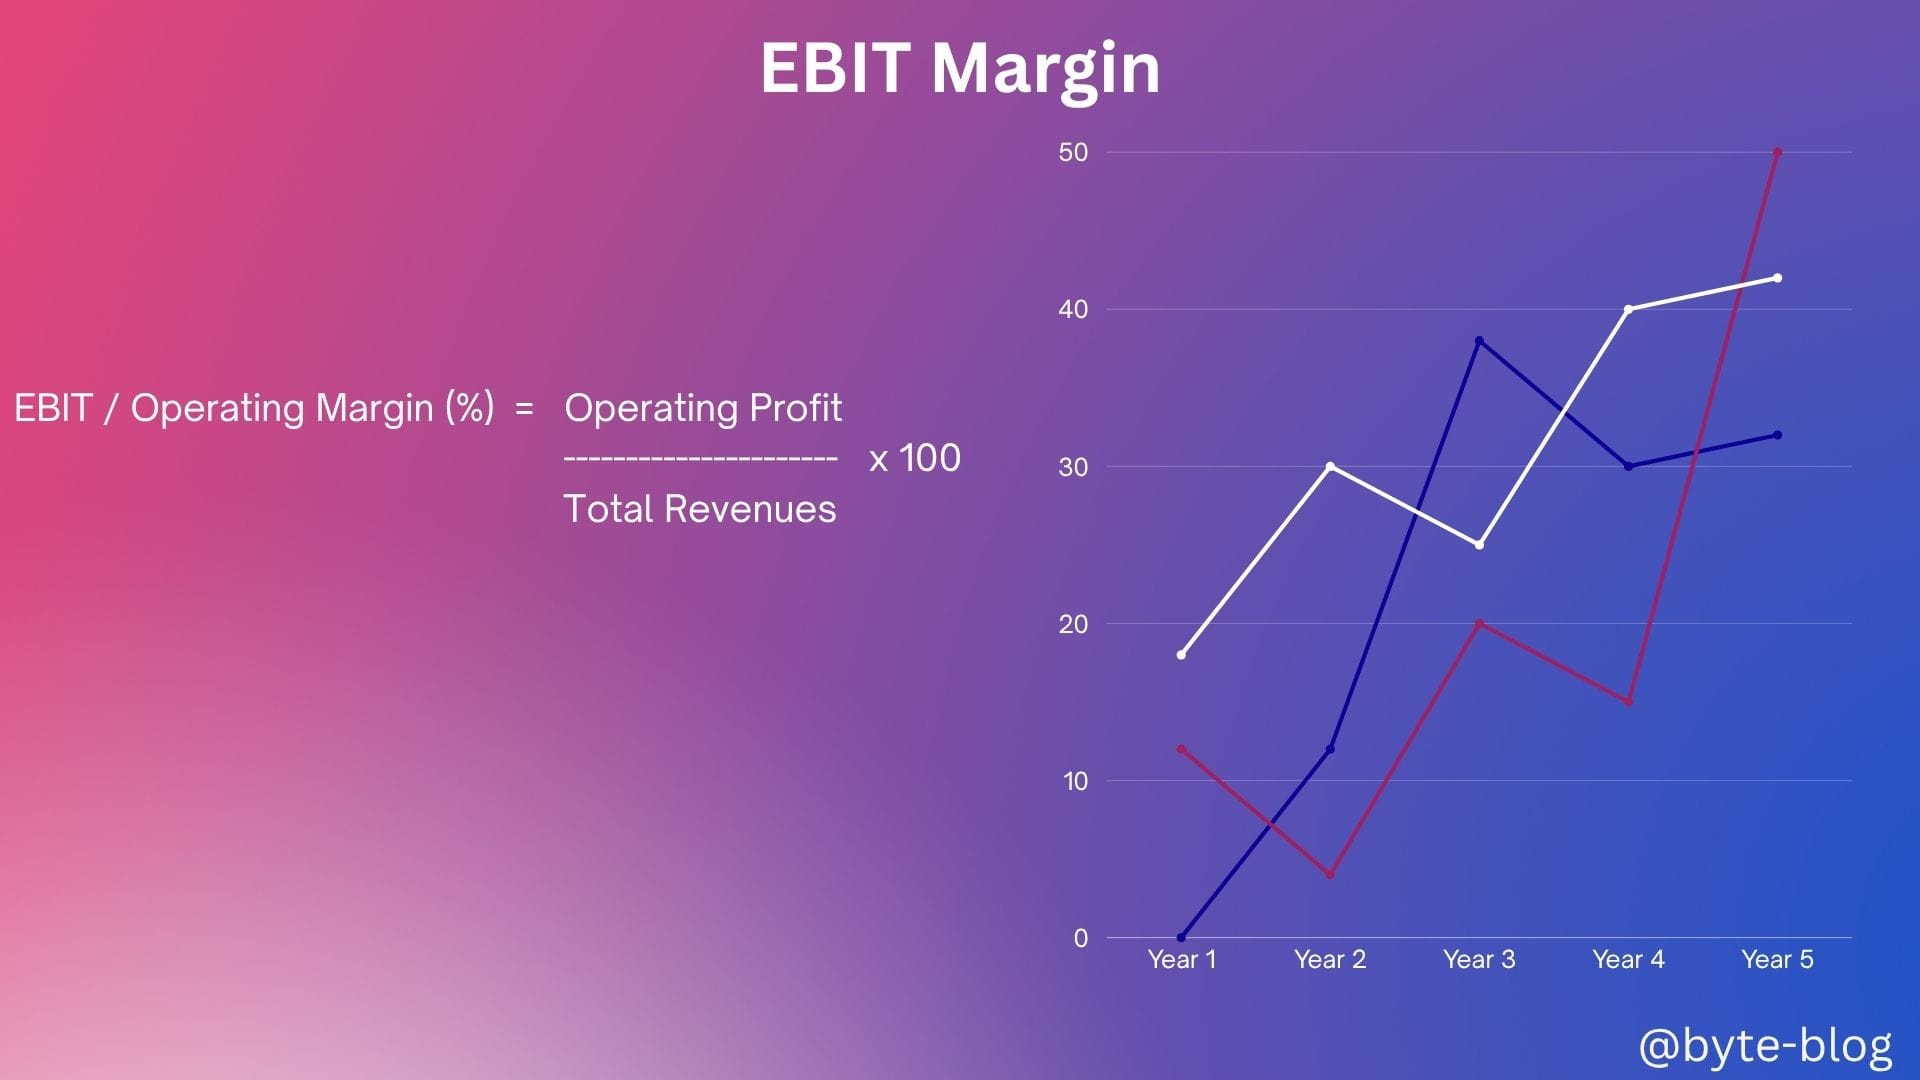
Now, a question may come to your mind that why don't we go all the way down to net profit? Why did we stop at operating profit?
The reason is that we want to know whether a company is OPERATIONALLY PROFITABLE - meaning we reduce expenses related to operations & does not take into consideration financing costs related to interest or tax expenses which has nothing to do with core operations.
Every company within the industry would have taken financing or debt at different levels which impacts the interest expense but their core operations remain the same.
Hence, removing the impact of financing makes the profitability numbers across companies comparable & focussed on operating performance,
Industry Numbers
With the above understanding, let us now explore the numbers.
For 2024 - 25, the consensus range for the global automotive industry's average EBIT margin is between 4.7% & 6% reflecting all value chain participants (OEMs, Suppliers etc). (Sources : One, Two, Three)
The numbers on it's own doesn't provide any context or meaning. Let us look at it from three angles :
- From a historical perspective - How was the industry performing in the past & the trend across various periods
- Breakup across value chain - How does this overall number break across individual players within the value chain?
- The reasons from structural perspective through the lens of :
- Competitive Dynamics
- Cost Structure &
- Market Characteristics
Historical Perspective
From a historical perspective, overall industry margins have been in decline as detailed below : (Sources : One, Two)
- Pre 2016 - 2017 : The global automotive industry's EBIT margin was around 7 - 8%, buoyed by growing sales in China & steady North American markets.
- 2016 - 2017 : EBIT margins peaked near 7%
- 2018 - 2019 : Early signs of a downturn, with EBIT margins holding at 6 - 7% but starting to slip as Chinese automotive sales - historically a profit driver - declined for the first time in decades.
- 2020 : The COVID-19 pandemic triggered a temporary collapse in global demand & production. Margins in 2020 dropped sharply (often below 5%)
- 2021 - 2023 : A partial rebound occurred, with industry average EBIT margins at 5.3% in both 2021 & 2023.
- 2024 - 2025(E) : The downward trend continues, with the latest studies reporting average EBIT margins between 4.7% & 6%.
Thus, the global automotive industry's profitability has been in steady decline post 2017, with EBIT margins dropping from nearly 7 - 8% pre-2017 to around 5% or less currently in 2025.
Let us now understand where in the value chain is this decline more pronounced, what is the margins within each value chain & the reasons behind these numbers.
Value Chain Breakup
Before we get into profitability breakup by value chain, it is important to understand that the profit margins within a value chain varies by geography.
We will get into the reasons in the next section & focus only on the numbers for now. Let us take the three major parts of the value chain (Sources : One, Two) :
- Original Equipment Manufacturers (OEMs)
- Suppliers &
- Ancillary Services (Dealerships, mobility / service providers)
Original Equipment Manufacturers (OEMs)
OEM profitability remains higher than suppliers, but margins have declined sharply, with average EBIT margins falling to 5.4% in early 2025—a more than 40% drop from their 2021 peaks.
Suppliers
Suppliers face even greater challenges. The average global supplier EBIT margin dropped to just 4.7% in 2024 from 5.3% in 2023. Chinese suppliers perform better (5.7%) compared with European (3.6%) and South Korean (3.4%) rivals
Ancillary Services
Downstream margins are under strain due to digital competition (direct sales, online platforms), and shifts in mobility/ownership trends. However, segments related to software, connectivity, and after-sales services are expected to see steady or rising profitability as service orientation increases
We continue our exploration into the automotive industry next week
