Strategy Byte - Week 55 Automotive Industry - Market Drivers

Table of Contents
- Recap
- Market Characteristics
- Value Stick
- Industry Structure
- Competitive Intensity
- Capital Investments
Recap
Last week, we did a long recap of our analysis into automotive industry till date. I feel it's important to have context behind our journey & hence I highly recommend to read last week's post before moving on.
From market size & concentration, we moved to profitability analysis to see whether the players within the automotive sector are making money or not.
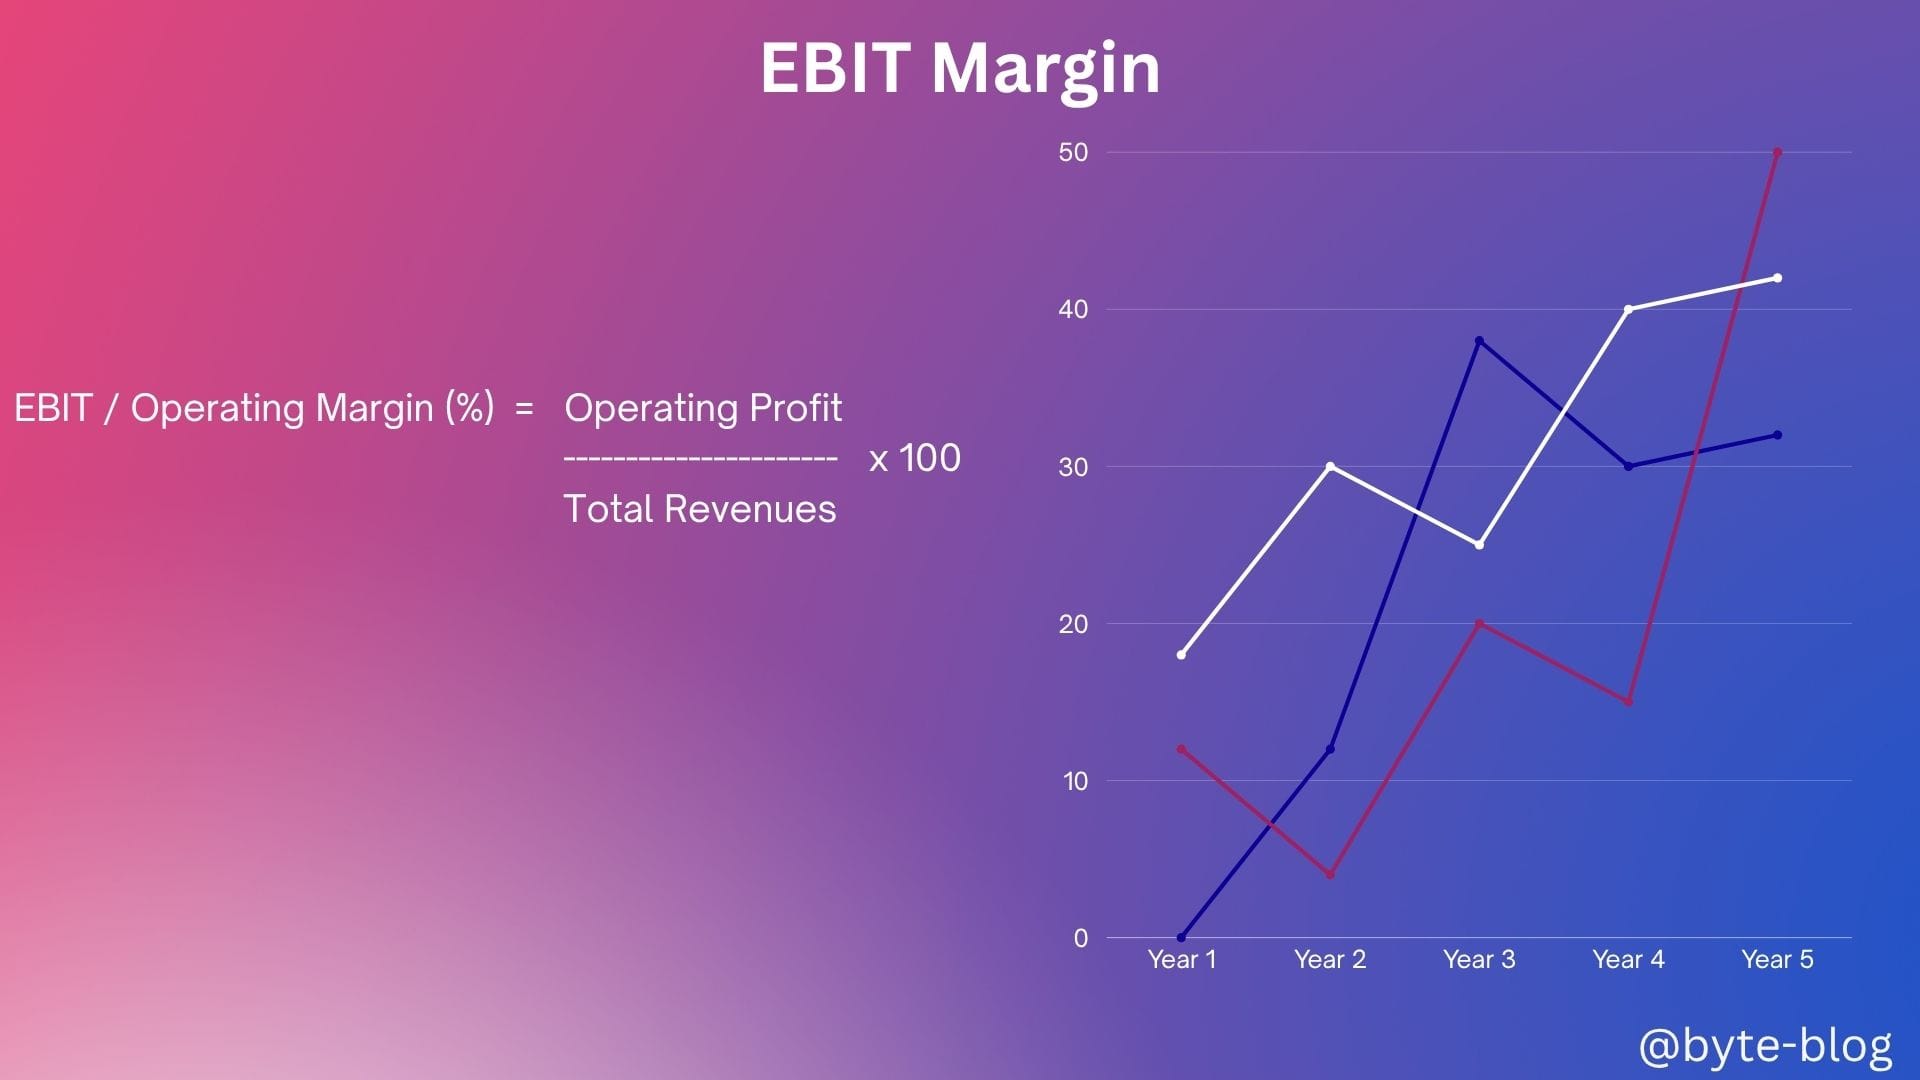
What does profitability mean? We used a benchmark number called EBIT margin or Earnings Before Interest & Tax Margin. It is also called Operating Profit margin.
Operating Profit is calculated by subtracting Cost of Goods Sold (COGS), depreciation, amortization & all relevant operating expenses from Revenue. Operating expenses include a company's expenses beyond direct production costs such as salaries & benefits, rent & related overhead expenses, R & D costs etc.
The EBIT or Operating Profit margin is calculated by dividing operating profit by Total Revenue which shows the percentage of operating profit derived from the total revenue.
Operating Margin (%) = (Operating Profit / Total Revenue) * 100

The next question is - Why operating profit & not net profit?
We want to know whether a company is operationally profitable before taking into consideration interest payments & debt taken by a company which has nothing to do with core operational effectiveness.
Also, it makes sense to look at operating profits as different companies might be at different debt levels making comparison difficult in terms of operational effectiveness.
We started with industry level EBIT margin for 2024-2025 between 4.7 - 6% reflecting all value chain participants (OEMs, suppliers etc).
We saw the trend of profitability from historical perspective where it has been in steady decline post 2017 with EBIT margins dropping from nearly 7 - 8% pre-2017 to around 5% or less currently in 2025.
We then dug deep into the automotive value chain to identify the trend in profitability & saw that there was decline across the three major parts of the value chain - OEMs, Suppliers & Ancillary services.
It's worth mentioning that profitability levels vary across geographies. E.g., Chinese suppliers perform better (5.7%) compared with European (3.6%) and South Korean (3.4%) rivals
Let us move forward to see the underlying drivers behind this fall in overall profitability in the automotive sector. We will tackle this topic from the below two angles :
- Market Characteristics &
- Cost structure
Market Characteristics
Value Stick
We mentioned in week 53 that there are substantial differences in profitability levels across industries. Why?
Each industry has different characteristics in terms of value generation & value capture. What does it mean?
Any industry or company within that industry generates value to customers through it's products or services & generates a willingness to pay from the customer. This value is generated by the company through procuring services from the suppliers &/or employees.
The profitability of any industry depends on how much of this value is captured by that industry & how much goes to the suppliers &/or employees.
This concept is captured by a "Value stick" - a concept from the book "Better, Simpler Strategy" by Felix Oberholzer-Gee.
What is a value stick?
Companies that achieve enduring financial success create substantial value for their customers, their employees or their suppliers. (Source : Better, Simpler Strategy)
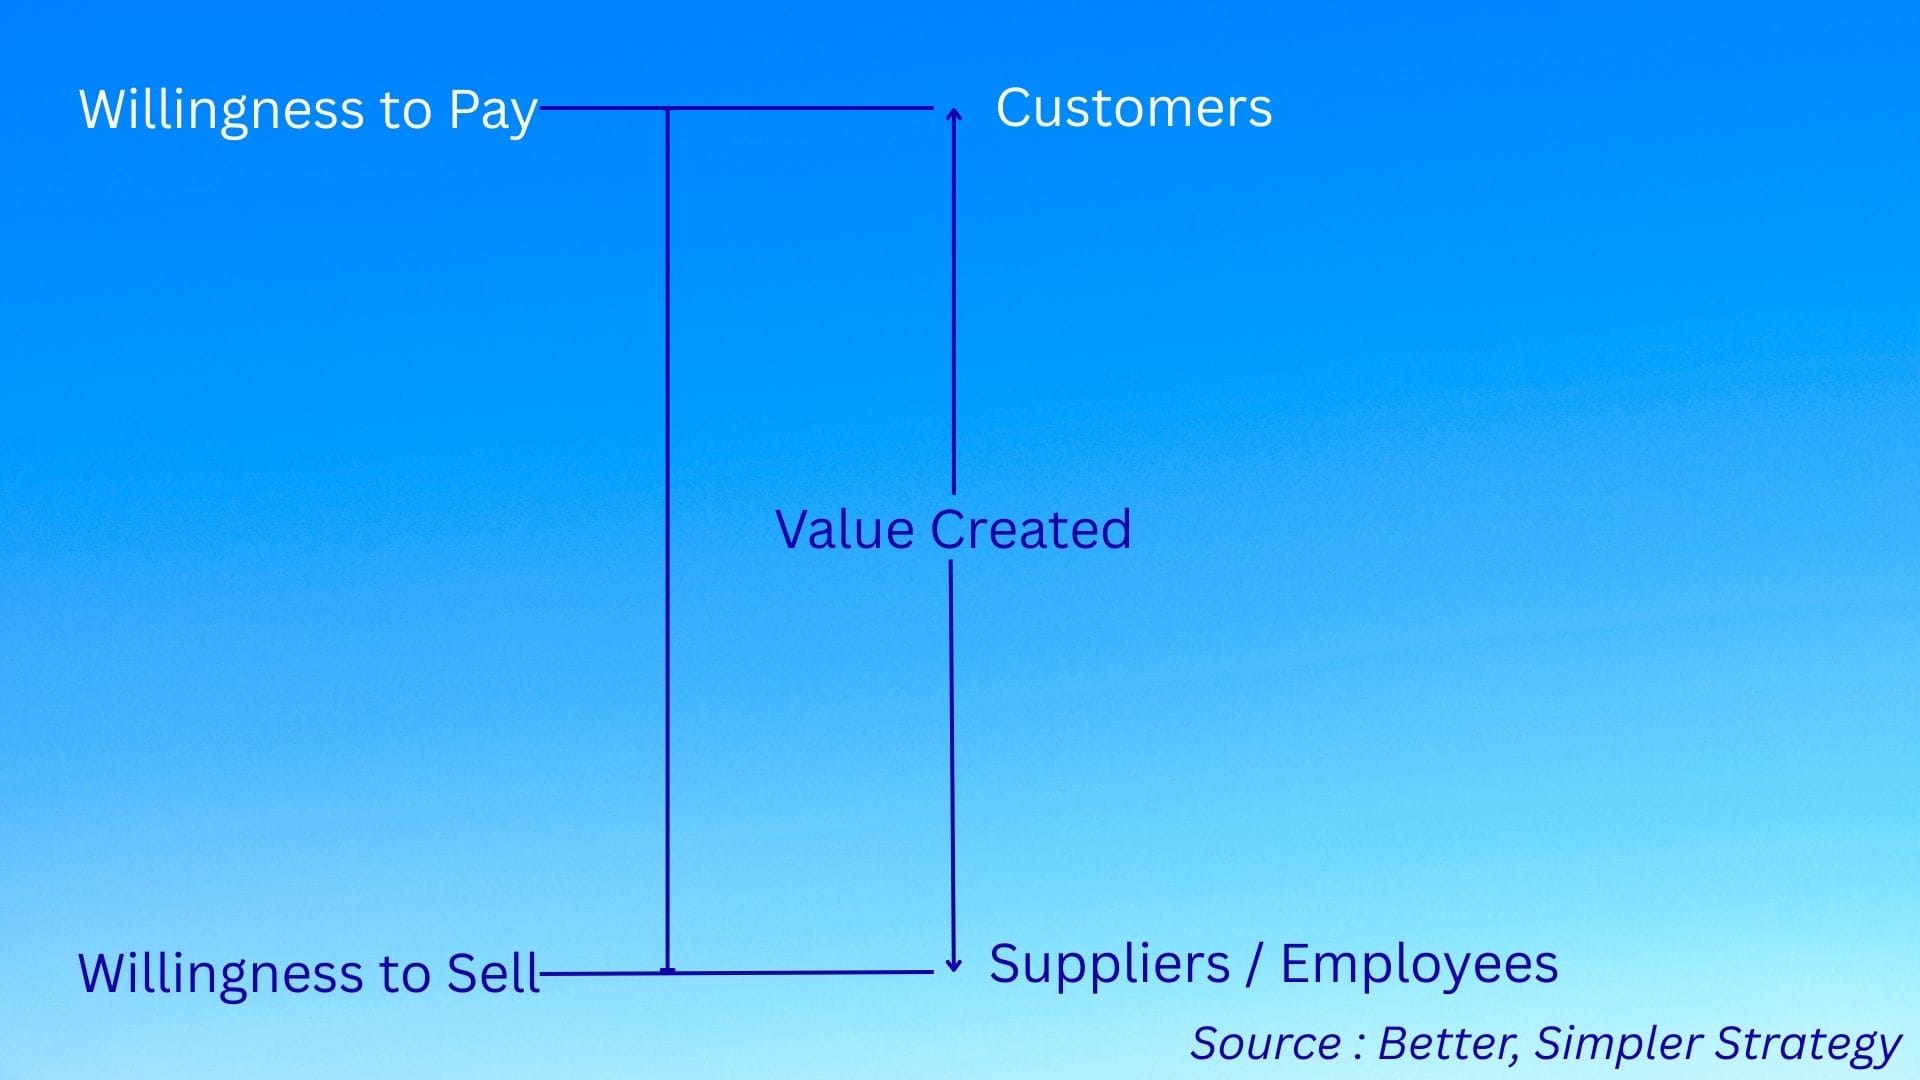
This is captured in a value stick visualized below :

Willingness to Pay (WTP) is from the customer side & represents the highest price a customer would pay for a product or service.
Willingness to Sell (WTS) is from a supplier / employee side where it represents the minimum or lowest price employees or suppliers are willing to provide services or goods to the company.
The value that a firm creates is the difference between WTP & WTS.
Value Created = WTP - WTS
In simple terms, there are only two ways to create & capture additional value
- Increase WTP (Willingness to Pay) - through value addition resulting in optimal pricing
- Decrease WTS (Willingness to Supply) - through cost efficiencies & vendor management
However, certain factors within an industry can complicate this equation & reduce how much value is created & retained amongst the industry players or gets diffused outside to suppliers &/or other players.
What are these factors ?
- Industry Structure & Competitive Intensity
- Capital Investments
- Market Maturity & Growth Rate
Let us explore each of these factors :
Industry Structure & Competitive Intensity
Industry Structure
We explored industry structure in week 49 & week 51 and so we will not repeat it here. But we focused on the key players & concentration within the value chain. As a quick recap,
- The global auto industry is dominated by a small set of OEMs - Toyota, Volkswagen, Hyundai, Kia, General Motors, Renault-Nissan & Stellantis which control over half of global annual sales.
- Toyota, Volkswagen, and Hyundai-Kia remain the global leaders by share, but Chinese automakers are growing fastest, with Geely and BYD posting the sharpest percentage gains. (Source : here)
- Renault Nissan, Ford, Honda, GM all reported falling global share, especially in mature markets. (Source : here)
Competitive Intensity
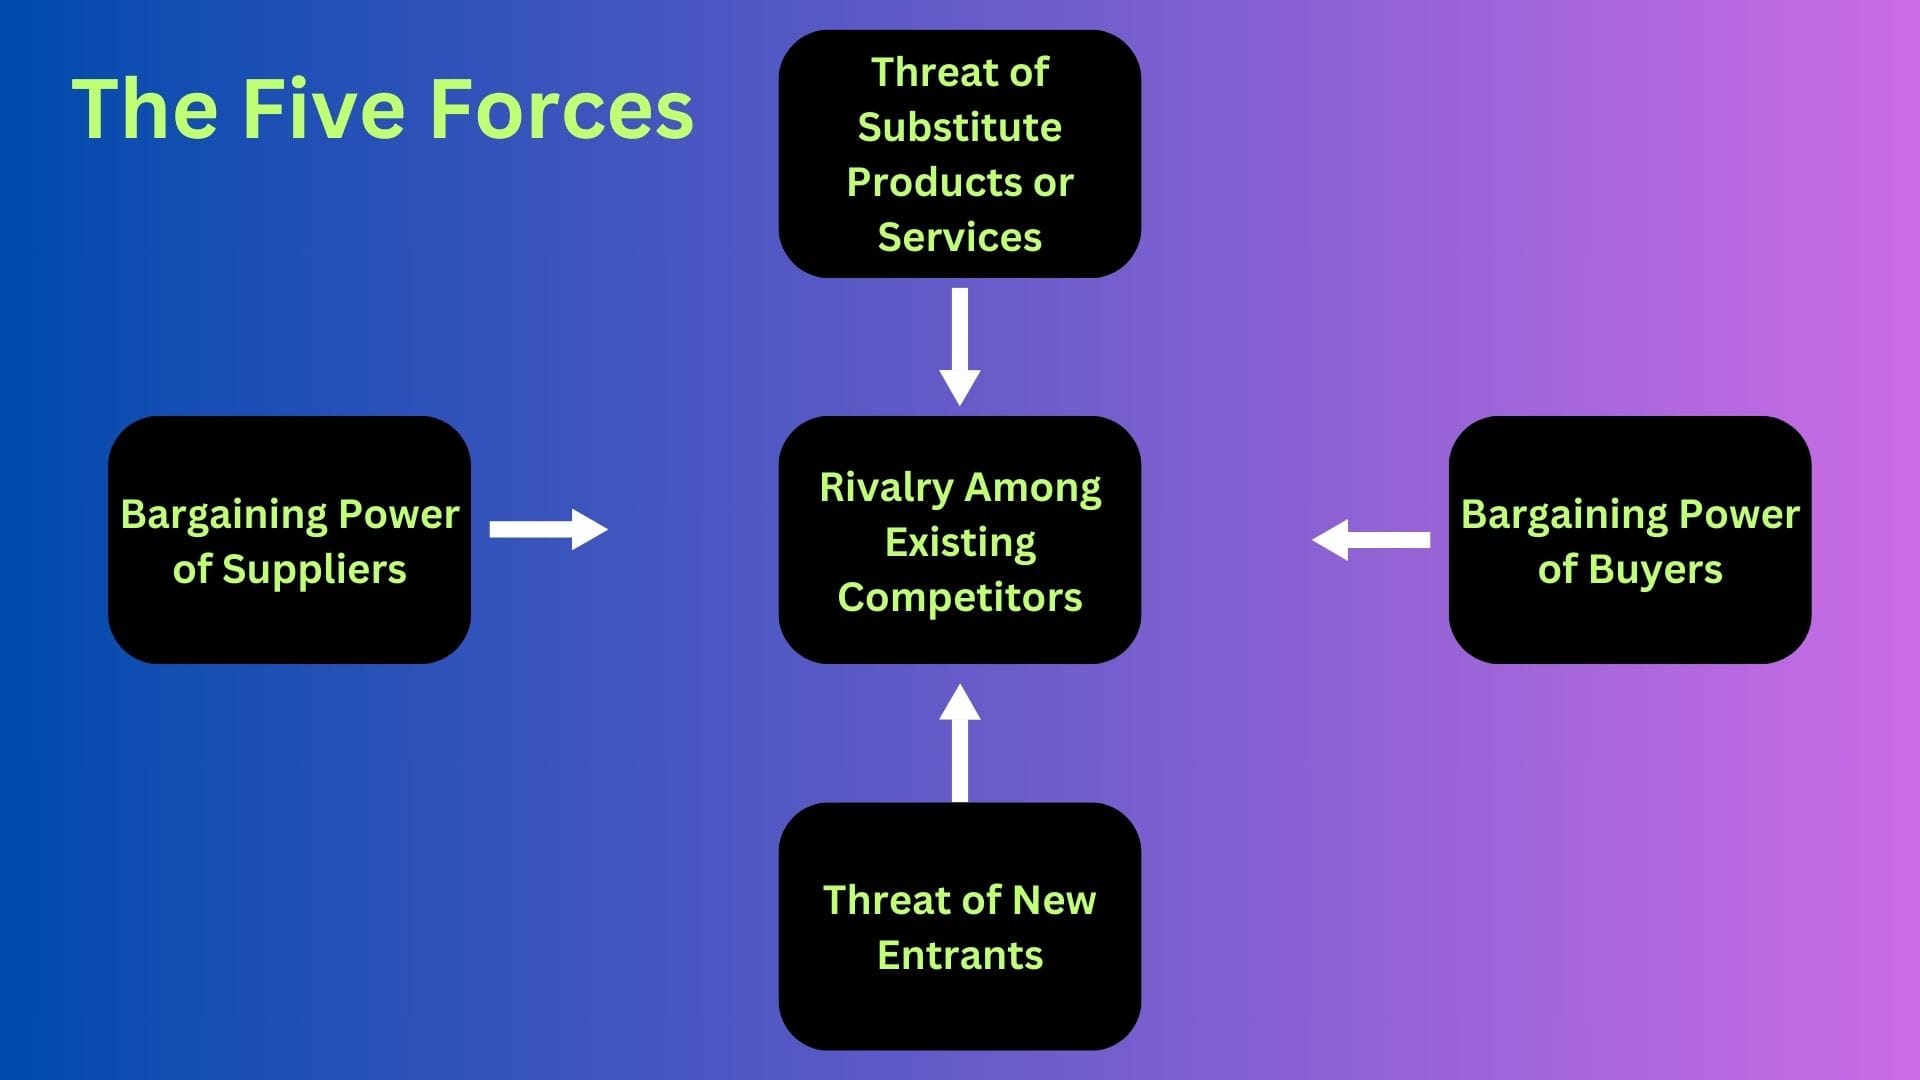
Let us again refer back to Porter's Five Forces (visualized below) to
- Analyze the power of the players within the value chain (e.g., suppliers, customers etc) &
- Analyze the intensity of competition responsible for profitability in the automotive industry & also predict future trends.

Rivalry among Existing Competitors
Industries with intense rivalry (e.g., airlines, retail etc) have less profit margins due to competition where the players are forced to compete on price. In the automotive sector, aggressive growth of Chinese OEMs and suppliers, plus new tech entrants, increased price competition.
This is especially severe in mass-market segments and in China’s domestic market, where automakers like BYD, Geely, and SAIC deploy aggressive pricing—often below cost—to build market share. Price wars, notably in China in 2024–2025, have compressed margins globally.(Source : here).
Bargaining Power of Suppliers
As we mentioned above, some of the value created for the customer by a company can be eaten away by the supplier if they are powerful, thus bringing up the "willingness to sell" reducing company profitability. E.g., Tier - 1 suppliers like Bosch, Continental & Magna, semiconductor suppliers & battery suppliers for EVs have significant bargaining power
Bargaining Power of Buyers
On the other side, buyers can also bring down prices if they are influential enough & cause prices to reduce bringing down the "Willingness to Buy" & in turn the value capture for the company. E.g., large dealerships, price sensitive consumers in mass markets etc. This reduces margin & also due to competition has limited upside potential in pricing.
Threat of New Entrants
The threat of new entrants is an established reality in the automotive industry with margins now being driven by efficiency in operating models & value adds. Traditional automakers are struggling to match the speed and cost-efficiency of Chinese NEV players, who use a new “operating model” with AI-enabled design, local supply chains, and tight feedback loops. (Source : here). As per the source,
- China’s “New Operating Model” enables automakers to bring vehicles to market twice as fast, with 40–50% less investment and a 30% cost advantage
- Chinese brands to reach 67% of the domestic market in 2025, while foreign brands will continue to lose market share
- Chinese automakers are to double their European market share to 10% by 2030
- AI-enabled solutions are cutting development times and verification costs by 20%
Capital Investments
Every decision driving operating profits or margin starts with the Balance sheet. This is where a company deploys it's funds to earn higher ROIC (Return on Invested Capital) than it's competitors & over it's WACC (Weighted Average Cost of Capital). We will explore this line of thinking in the next couple of weeks.
The automotive industry is capital intensive which means the manufacturing process requires massive upfront investments in factories, plant & equipments, Research & Development.

Only a few players are able to deploy the level of capital needed to be a significant player in the automotive industry. This creates barriers to entry into the automotive industry which restricts new players.
But this creates another problem - investing such huge funds in manufacturing facilities means that fixed costs will be high & they need to sell finished cars at a sufficient price to recoup these fixed costs.
So, they have to manufacture & sell enough cars to recoup these costs, which in a low demand & highly competitive environment may be at slashed prices to increase sales volumes which will further reduce their operating margins.
Next week, we will explore the market maturity of the automotive industry & also the cost structure which is another significant variable after market characteristics.