Strategy Byte - Week 56 Automotive Cost & Efficiency Metrics

Table of Contents
- Recap
- Cost & Efficiency Metrics
- Cost to Income Ratio
- Citations with Links
Recap
During Week 55, we explored the underlying drivers behind the performance of the automotive sector under :
- Market characteristics
- Cost Structure
Market Characteristics
Each industry has different characteristics in terms of value generation & value capture.
In other words,
- Any industry or company within that industry generates value to customers through it's products or services & generates a willingness to pay from the customer.
- This value is generated by a company through procuring & paying for services/ materials from suppliers &/or employees through their willingness to sell.
The net value captured as above is what results in profitability for that industry.
This value capture can be visualized through a "value stick" :
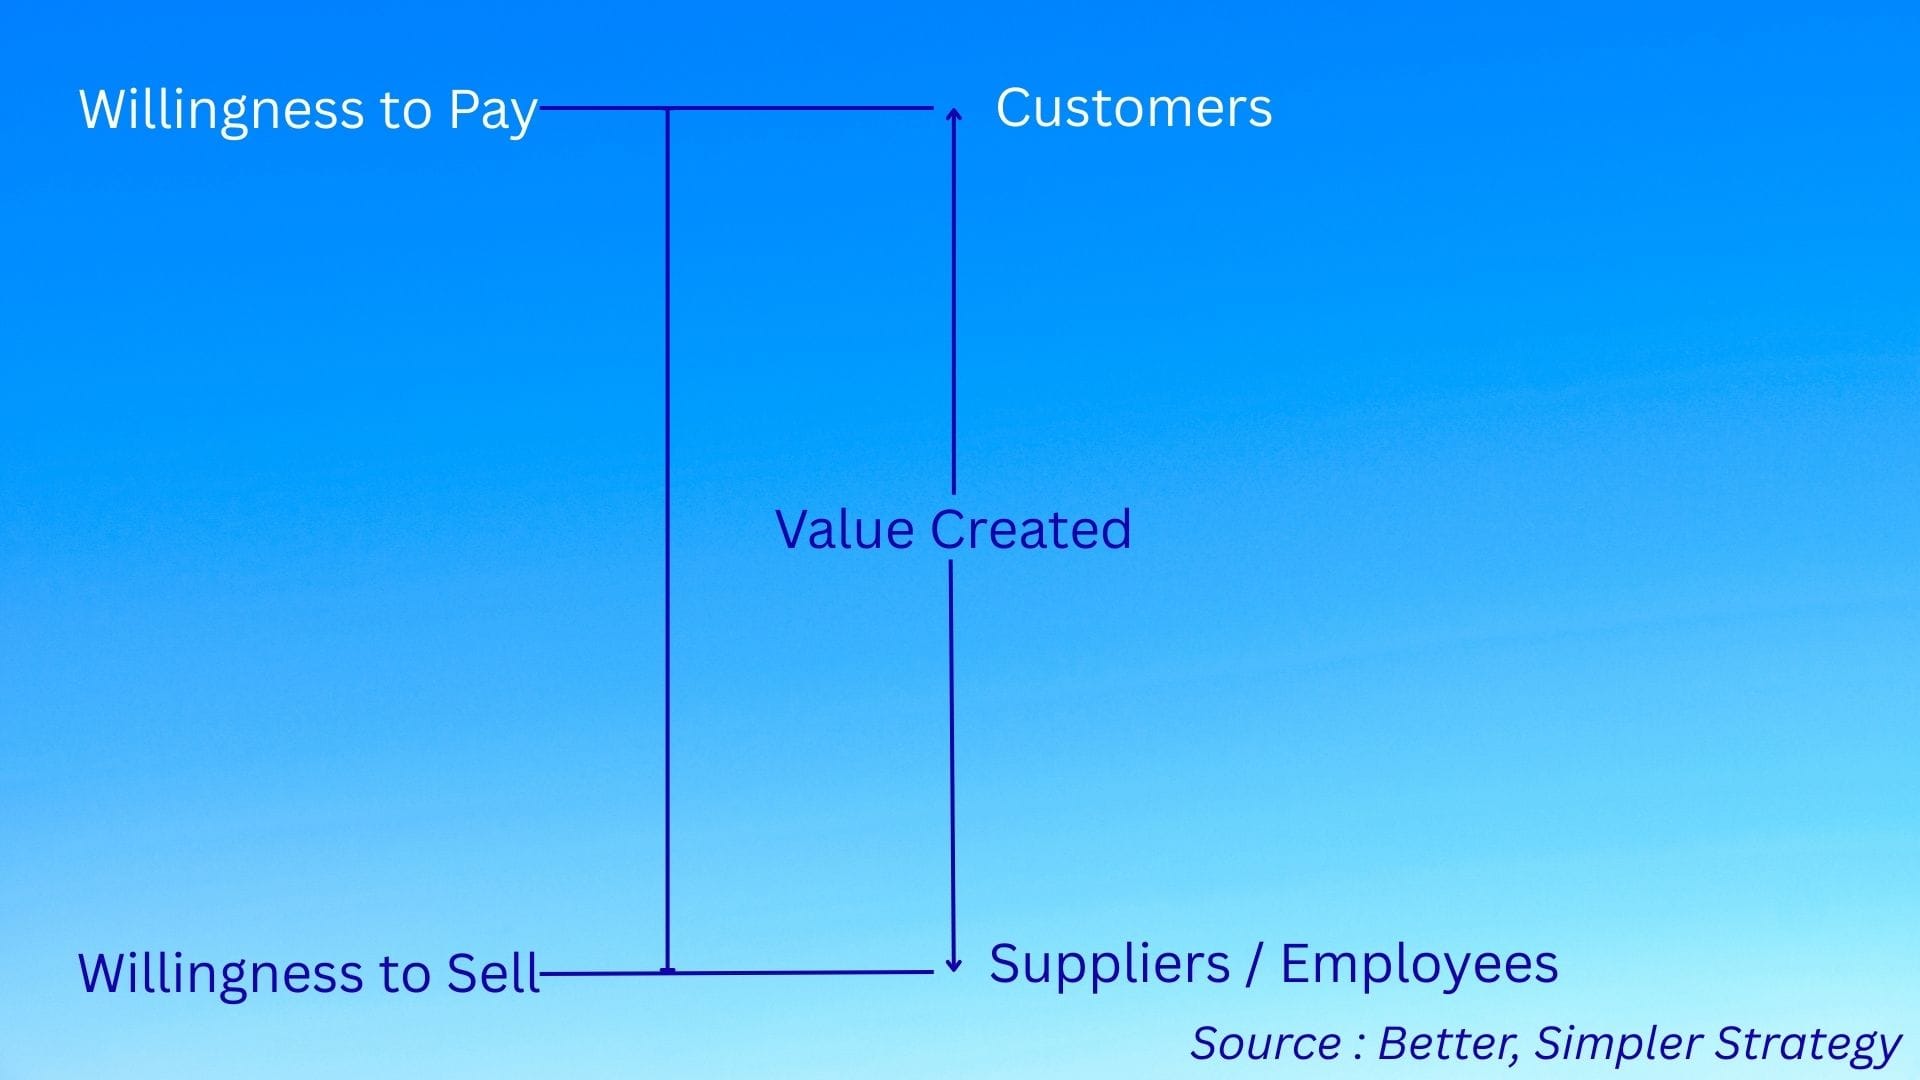
The value that a firm creates is the difference between WTP (willingness to pay) from the customer & WTS (willingness to sell) from suppliers / employees.
Value Created = WTP - WTS
However, reality is not as straightforward as the above equation due to certain factors which can complicate this equation & reduce how much value is created & retained amongst the industry players or gets diffused to suppliers &/or other players. These factors are :
- Industry Structure & Competitive Intensity
- Capital Investments
- Market Maturity & Growth Rate
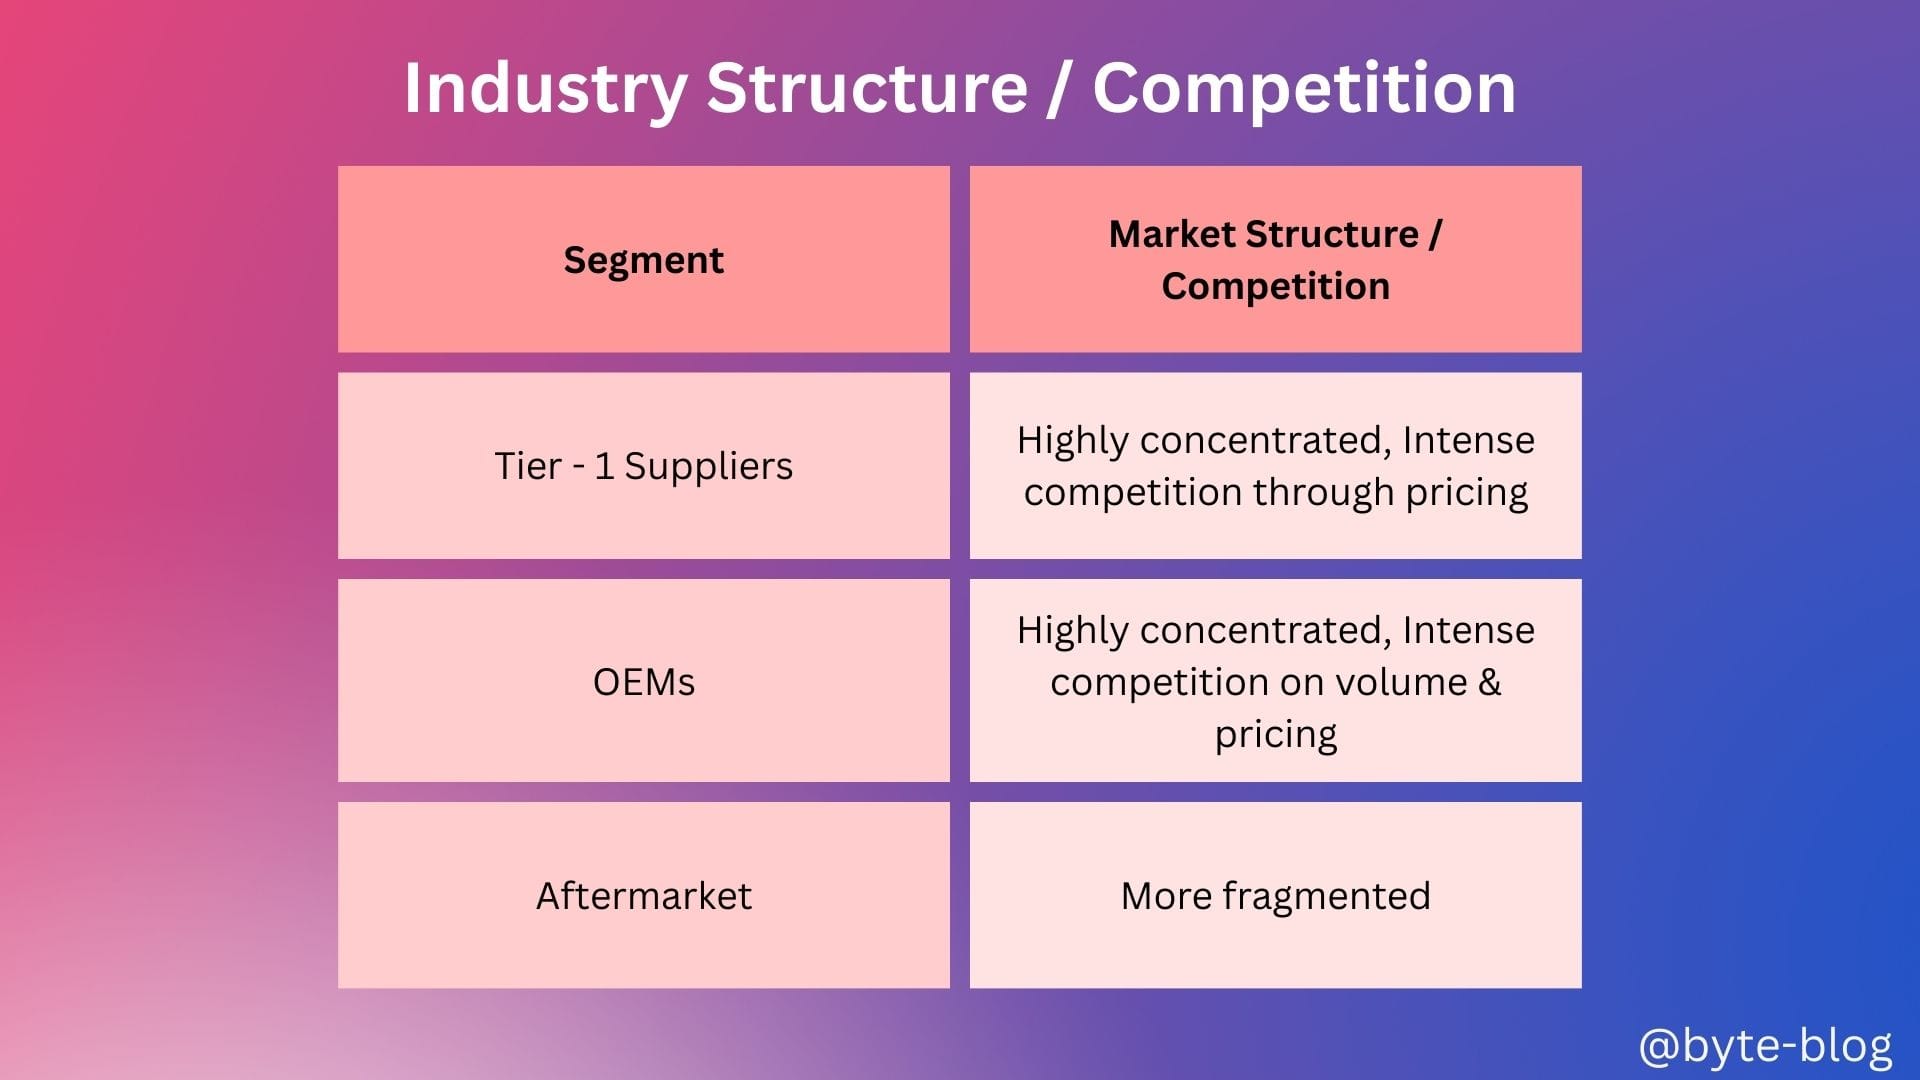
We can summarize last week discussion on Industry structure & competitive intensity as below :
Then we ventured into capital investments with the below statement ;
Every decision driving operating profits or margin starts with the Balance Sheet.
The automotive industry is capital intensive which means the manufacturing process requires massive upfront investments in factories, plants & equipments, R & D etc.
So there are few players in the automotive industry as this huge upfront investment creates barriers to entry for new players unless they are also deep-pocketed.
But this creates another problem - investing such huge funds in manufacturing facilities means that fixed costs will be high & the breakeven point required to recoup these costs will be high meaning they have to sell more cars.
But in a highly competitive environment that the automotive industry is, this is not easy unless they slash prices in line with competitor prices which will reduce their operating margin.
We will explore Market maturity & growth rate at a later stage. Now we will deep dive into cost structure & efficiency metrics of the automotive industry. Why efficiency metrics along with cost structure?
This gives a complete picture in terms of efficiency as low cost combined with high efficiency metrics shows that the spends are being directed in the right places to drive higher RoI & RoCE (Return on Investments & Return on Capital Employed).
Cost & Efficiency Metrics

We know the automotive industry is highly capital intensive. The players need to make high upfront investments with the objective to earn a return for the investors. But this results in higher operating expenses increasing cost to income ratio (inversely, reducing margins). Hence, operational efficiency in managing processes is key. Let us understand how the numbers stack up?
For the purpose of this analysis, we will start with the overall industry & then go down to OEMs (Original Equipment Manufacturers). As a recap,
In the automotive world, OEM stands for original equipment manufacturer. These companies design and build vehicles and also produce the parts used during production. Major automotive OEMs include BMW, Ford, General Motors, Honda and Toyota. (Source : here)
For analyzing cost efficiency, we will use the cost to income ratio . For efficiency metrics, we will analyze the below :
- Asset Turnover
- Inventory Turnover &
- Capacity Utilization
Cost to Income Ratio
Definition
Let us first define the KPI for better understanding :
Cost to Income ratio (%) = (Operating Expenses / Total Revenue) * 100
In simple terms, the ratio is arrived at by dividing total operating expenses by total revenue. It shows the total spending (operational costs) as a percentage of revenue. Lower cost to income ratio means the revenue is earned through low spends which shows higher cost efficiency.
But, the flip side of lower cost to income ratio is underspending which means not spending enough to grow or improve revenue. So, it is important to analyze each line item of cost to ensure the company is spending optimally so that:
- Current revenue generation is maintained &
- Future revenue growth is facilitated
For our purpose, we will assume that the costs incurred are necessary for revenue generation.
Now, with that in mind, let us dive into actual numbers :
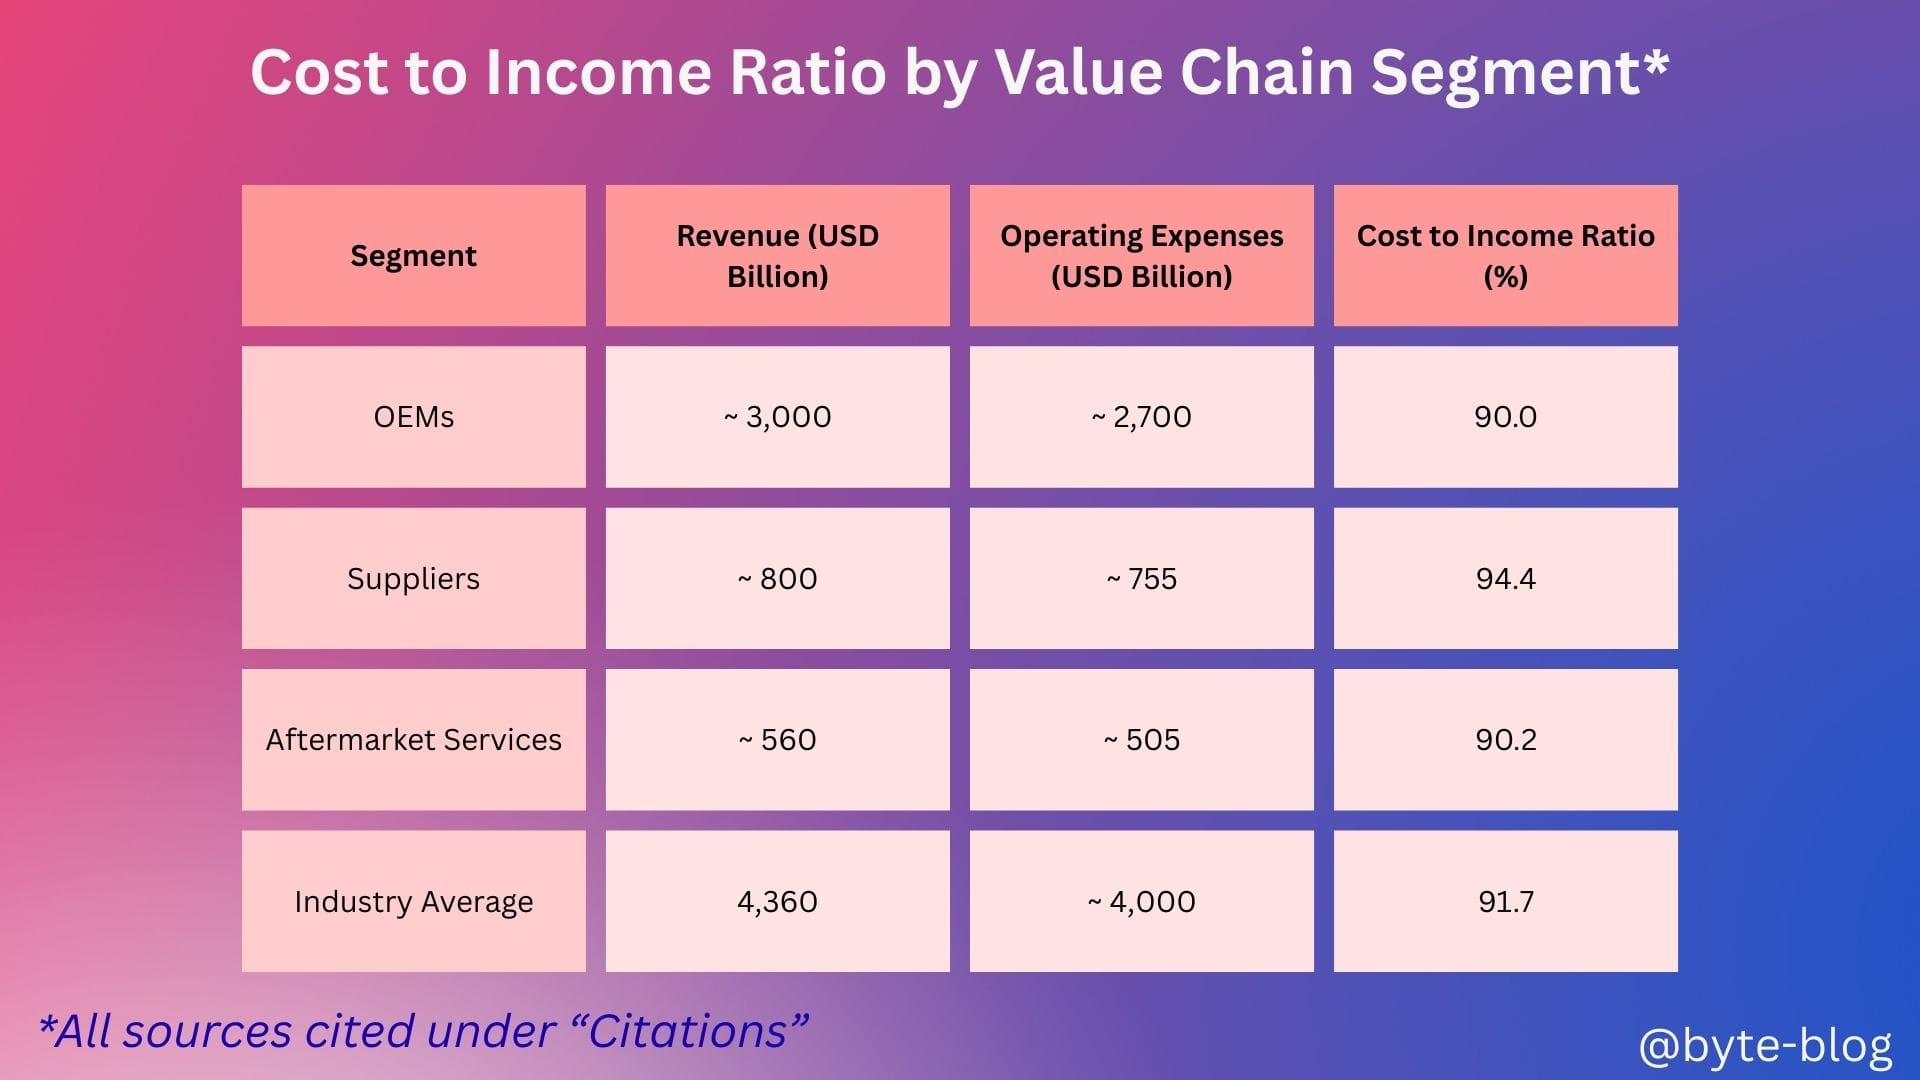
Industry Level
Based on latest 2024 financials & industry reports,
- Industry Revenue ~ USD 4.36 trillion (for global, including OEMs, suppliers, services etc)
- Industry Operating Expenses ~ USD 4.0 trillion (including COGS + SG&A + R & D)
COGS = Cost of Goods Sold
SG&A = Selling, General & Administration expenses
R & D = Research & Development expenses
- Cost to Income Ratio (Overall Industry Level) = (USD 4.00 trillion / USD 4.36 trillion) * 100 = 91.7%
In simple terms, for every USD 100 of revenue, USD 91.7 is spent on operating expenses.
Value Chain Level
Now, let us go one level down by value chain to see how the cost to income ratio stacks up :
Let us recap the value chain from Week 49 :
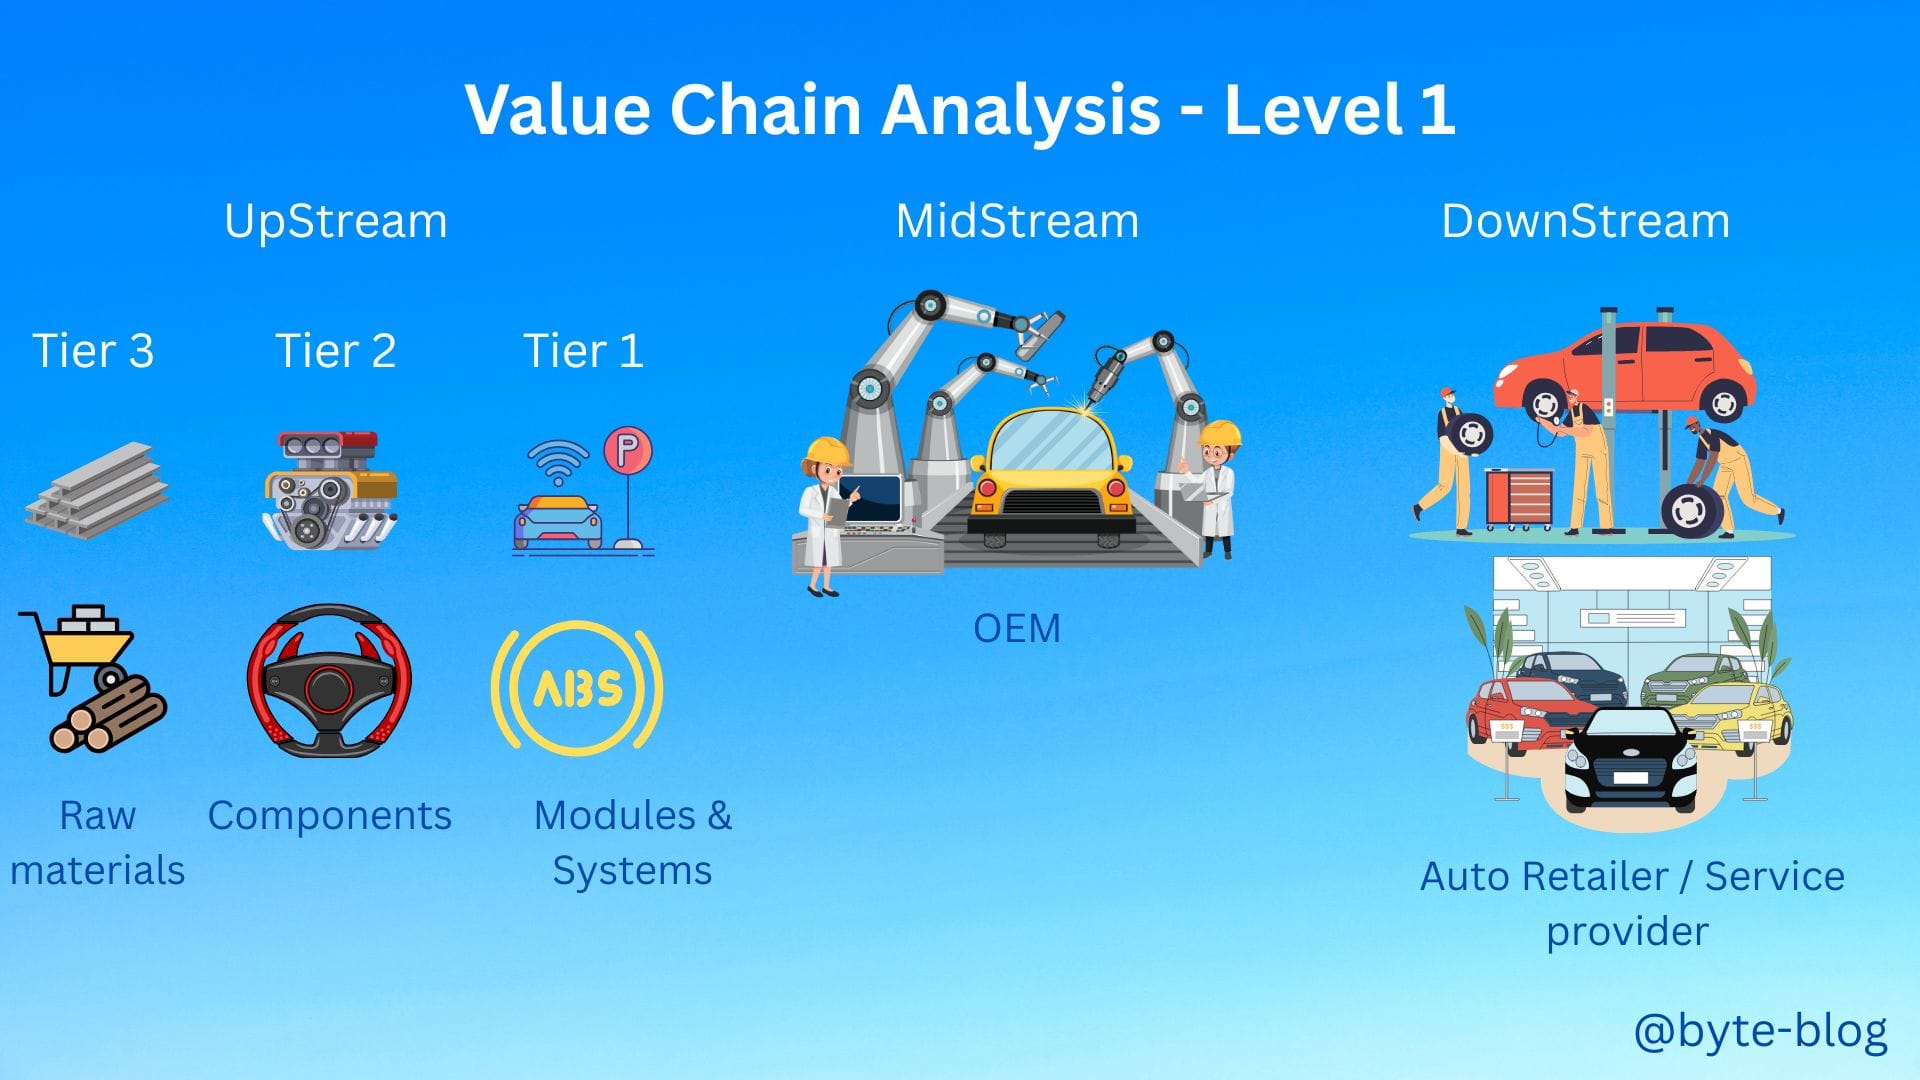
The suppliers provide the raw materials, components & systems necessary for vehicle production. These suppliers have direct relationships with OEMs and are heavily involved in design and engineering. The entire process is supported by logistics partners who manage the timely transportation of materials and finished products in the value chain.
That also means that they are the most vulnerable in terms of maintaining margin as
- They are subject to high volatility in raw material prices on the input side
- They may or may not be able to pass on these raw material cost increases to their OEM customers who are themselves under margin stress.
With the above in mind, the key takeaways from the above table are :
- OEMs (Vehicle manufacturers) Cost to income ratio at 90% reflects the high capital intensity of the investments & the resulting operating expenses to maintain their thin margins - average EBIT margins ~ 5.4%
- Suppliers cost to income ratio higher at 94% reflects how their margins are compressed by high raw material costs which they are unable to pass on to their OEM customers who are themselves saddled with high costs & compressed margins with average EBIT margins ~ 4.7%
- After market services (Distribution & Services) cost to income ratio at 90% reflects slightly better position compared to suppliers but strong competition in the parts & service market.
OEM Level
Let us now analyze the cost to income ratio at individual OEM level :
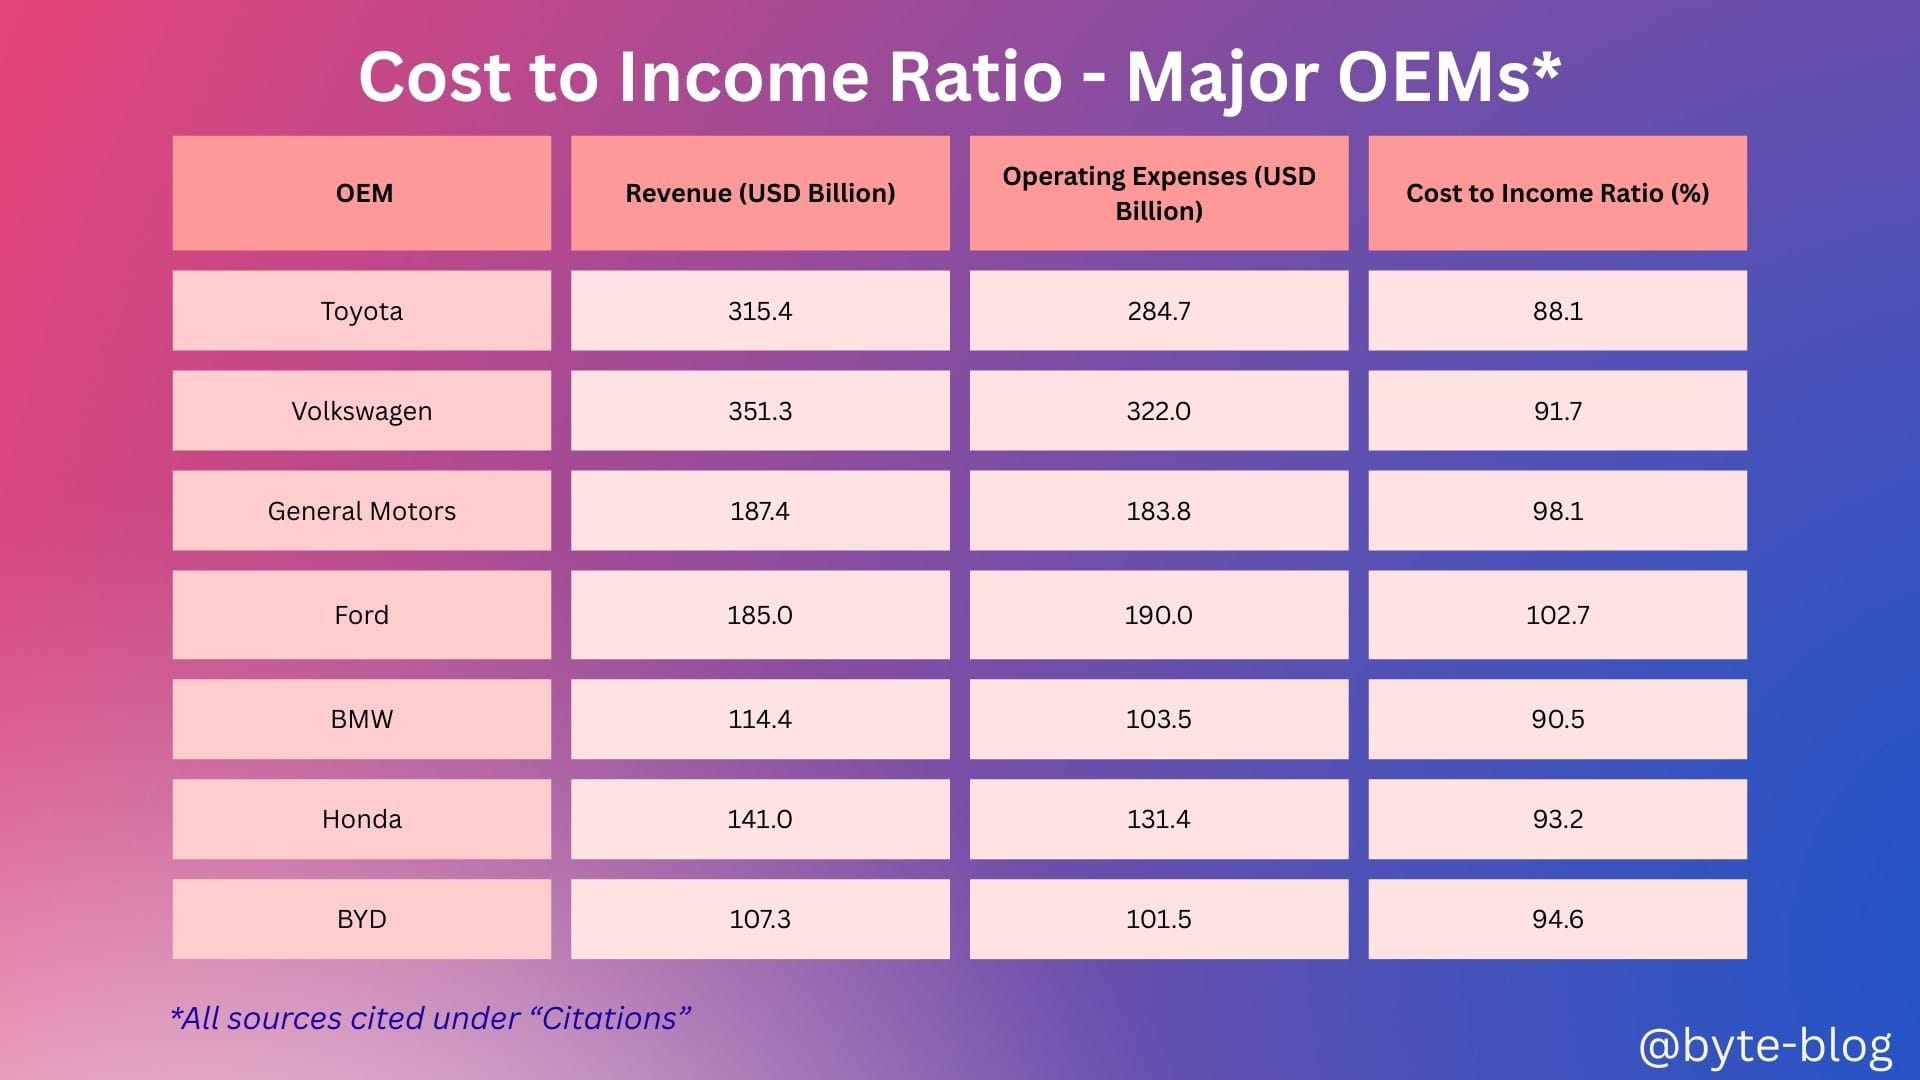
Cost-to-income ratios for most major OEMs in 2024 range from 90–100% (except for Ford which exceeds 100%) , reflecting intense cost pressures across the industry but also highlighting the scale efficiencies of some of them like Toyota, BMW etc. This reduces the margin, making ongoing cost discipline and product mix optimization critical for profitability.
Next week, let us explore the efficiency metrics.
Citations with links
• Toyota Motor FY2024 Financial Summary
• Volkswagen FY2024 Core Brand Group Results
• BMW AG FY2024 Financial Statements
• GM FY2024 Operating Expenses - Macrotrends
• Bain Automotive Profitability Report 2025
• Lazard Automotive Supplier Study 2025
• IBISWorld Global Automobile Industry Report 2025
• FintechFutures Industry Size 2024
• Berylls Aftermarket Insight 2024
• Krungsri Industry Outlook Auto Parts 2024-2026
• Ford FY2024 Operating Expenses - AlphaQuery
• BMW AG FY2024 Financial Statements
• Honda 2024 Results
• BYD 2024 Results