Strategy Byte - Week 57 Efficiency Metrics

Table of Contents
- Recap
- Asset Turnover Ratio
- Capacity Utilization
- Inventory Turnover Ratio
- OEM Efficiency Benchmark
- References & Citations
Recap
Following our exploration of cost metrics in Week 56, this penultimate analysis of the automotive industry focuses on efficiency metrics and their strategic integration with cost metrics.
Why Combine Cost and Efficiency Metrics?
The convergence of low costs with high efficiency metrics reveals optimal capital allocation—indicating that investments are strategically directed toward initiatives that maximize both Return on Investment (RoI) and Return on Capital
For analyzing cost efficiency, we used the cost to income ratio which we defined as:
Cost to Income Ratio (%) = (Operating Expenses / Total Revenue) * 100
At the overall industry level, based on 2024 financials & industry reports, the cost to income ratio for the automotive industry is at 91.7%.
Then we went down one level by value chain visualized as below (Refer Week 56 for citation links):
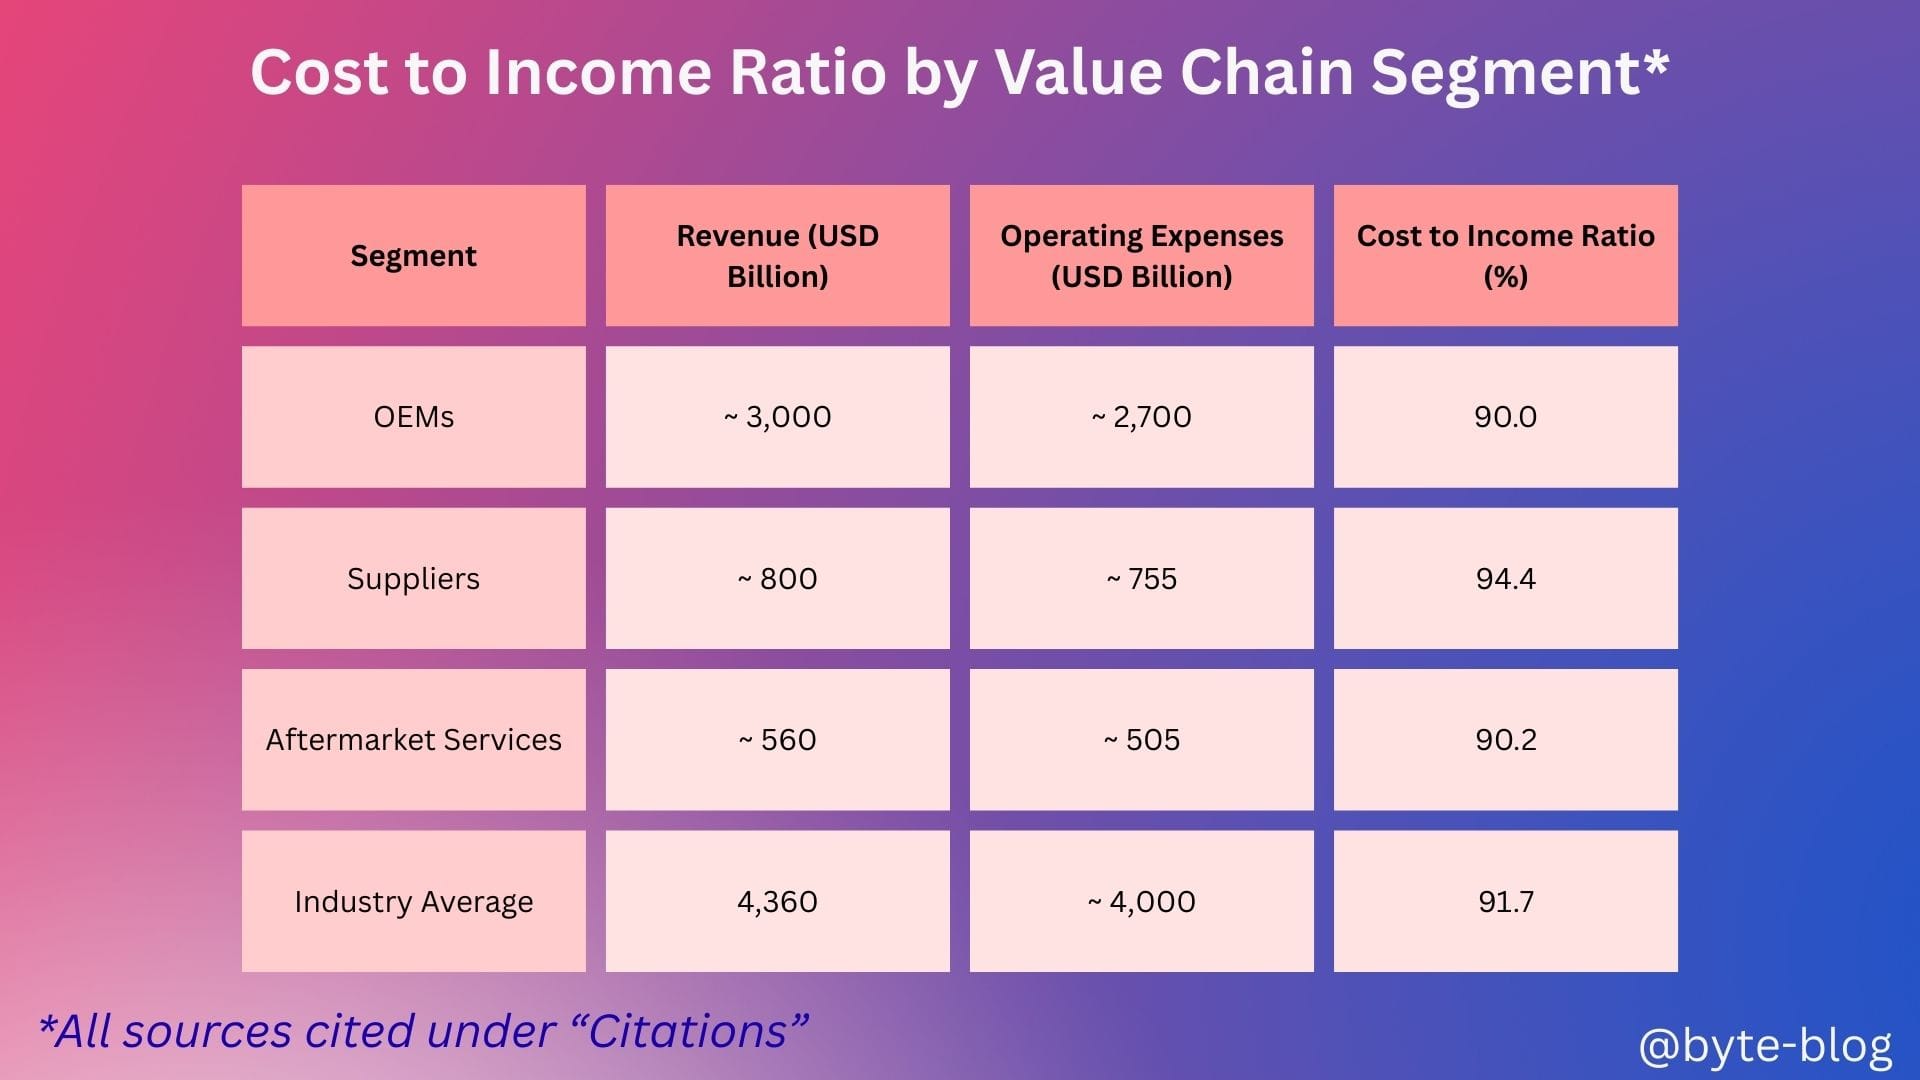
After discussing the key takeaways from the above, we dived one level down to analyze the cost to income ratio at individual OEM level visualized as below (Refer Week 56 for citation links):
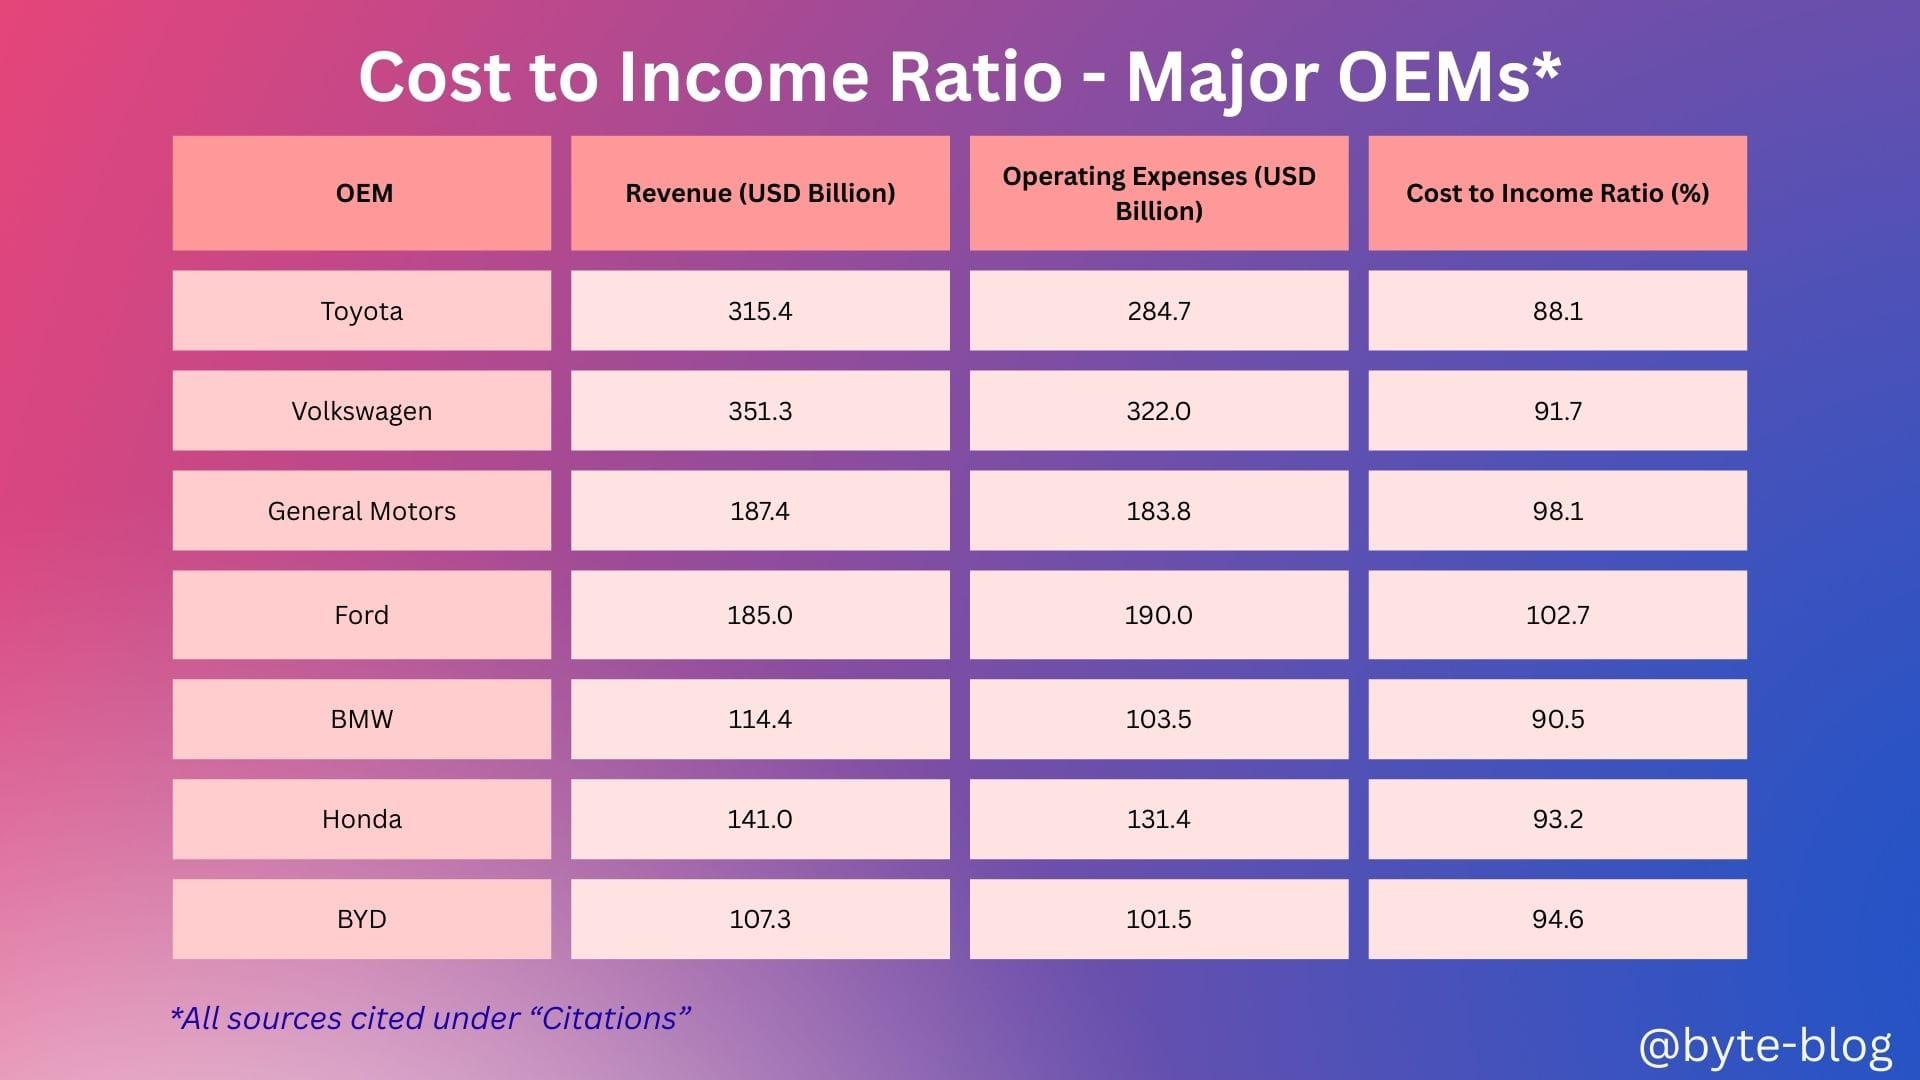
Cost-to-income ratios for most major OEMs in 2024 range from 90–100% (except for Ford which exceeds 100%) , reflecting intense cost pressure across the industry but also highlighting the operational efficiencies of some of them like Toyota, BMW etc.
The automotive industry is very competitive with cut-throat pricing. This reduces margin, making ongoing cost discipline and product mix optimization critical for profitability.
Let us explore the other efficiency metrics :
- Asset Turnover Ratio
- Inventory Turnover Ratio &
- Capacity Utilization
Asset Turnover Ratio
First of all, let us understand what is Asset Turnover Ratio?
Asset Turnover Ratio is an efficiency ratio which measures how efficiently a company uses it's assets to produce revenue or sales.
The formula for calculating asset turnover ratio is :
Asset Turnover Ratio (%) = (Total Revenue or Sales / Average Assets) * 100
In simple terms, a company invests in assets to generate revenue or sales. Higher revenue or sales per dollar (or any other currency) of asset invested means higher efficiency in usage of those assets. So,
- Higher Asset Turnover Ratio means a company is efficiently utilizing it's assets to generate revenue or sales through better marketing or sales performance &/or operational efficiency.
- Lower Asset Turnover Ratio means a company is not utilizing it's assets with operational inefficiencies or sales underperformance.
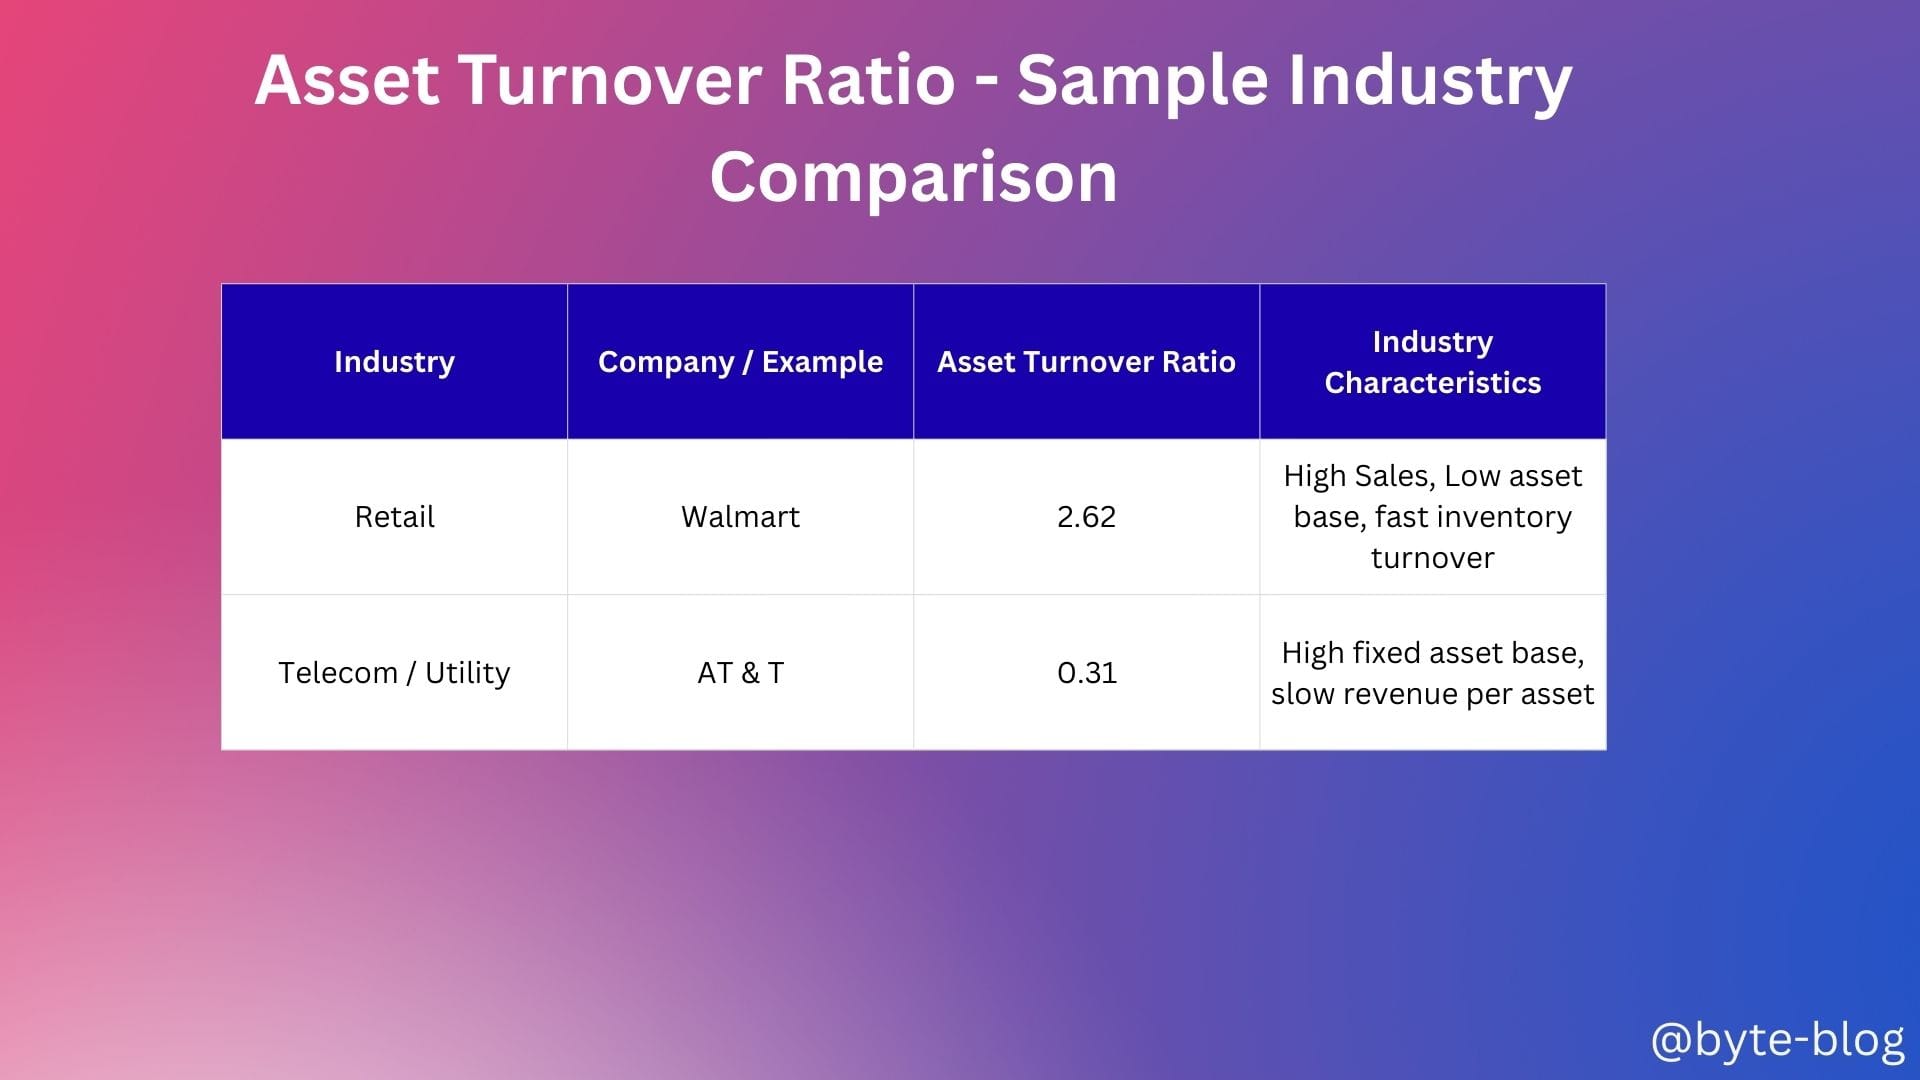
It also depends on industry characteristics. For e.g., retail industry has lower asset base as they are not as capital intensive compared to manufacturing industries or utilities. Hence their asset turnover ratio will be higher than say, a capital intensive industry like utility or telecom sector. Visualizing this as an example : (Source : here)
Let us now see how the value chain in the automotive industry stacks up in terms of asset turnover ratio. (Sources : 1, 2, 3)
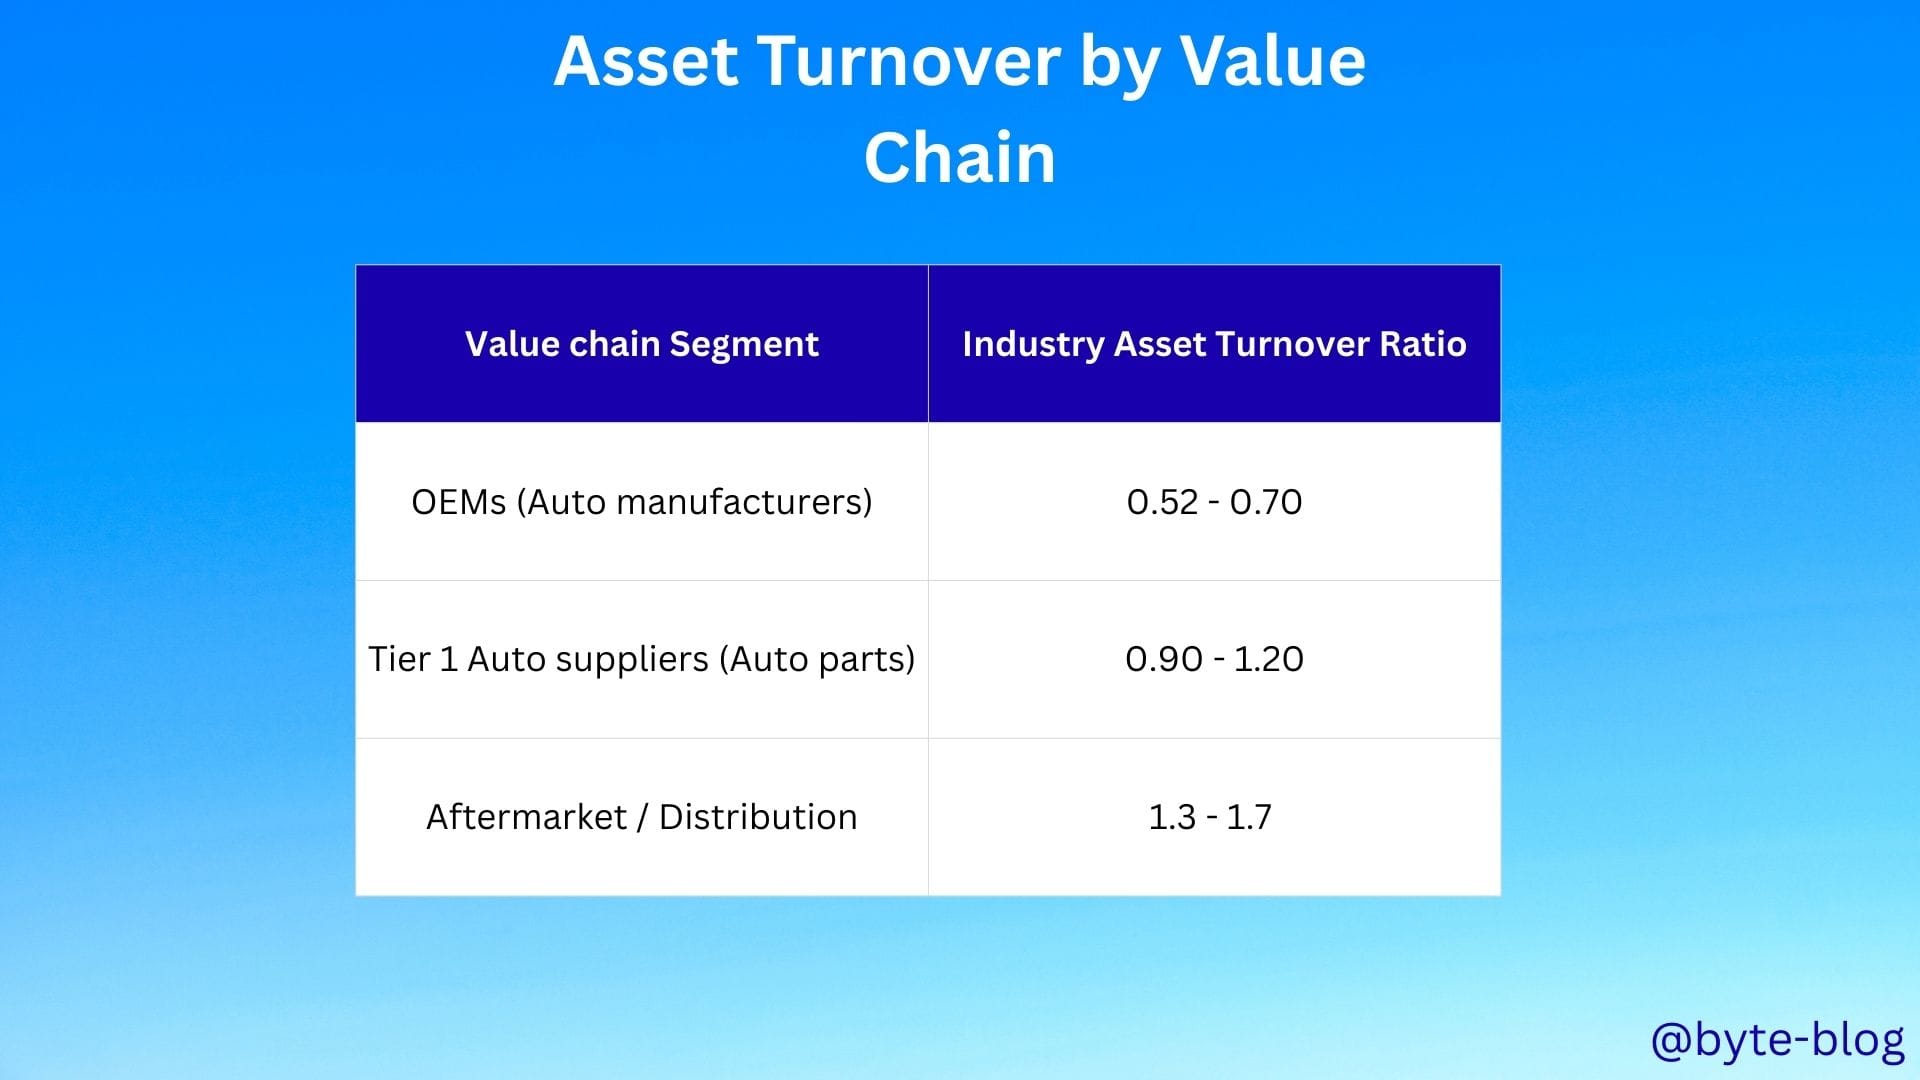
From the above, we can see that :
- OEMs have the lowest asset turnover ratio reflecting their capital intensive nature where the OEM players invest heavily in manufacturing & assembling facilities in a highly competitive environment.
- Suppliers have higher ratios compared to OEMs due to their lighter asset base on account of specialized nature of on demand manufacturing for OEMS.
- Aftermarket / distribution has the highest ratios due to low capital intensive (showrooms, distribution centers etc) nature & faster inventory turnover.
Now, let's go one level deeper & examine how the OEMs stack against each other in terms of asset turnover ratio (Sources : 1, 2, 3, 4, 5, 6, 7)
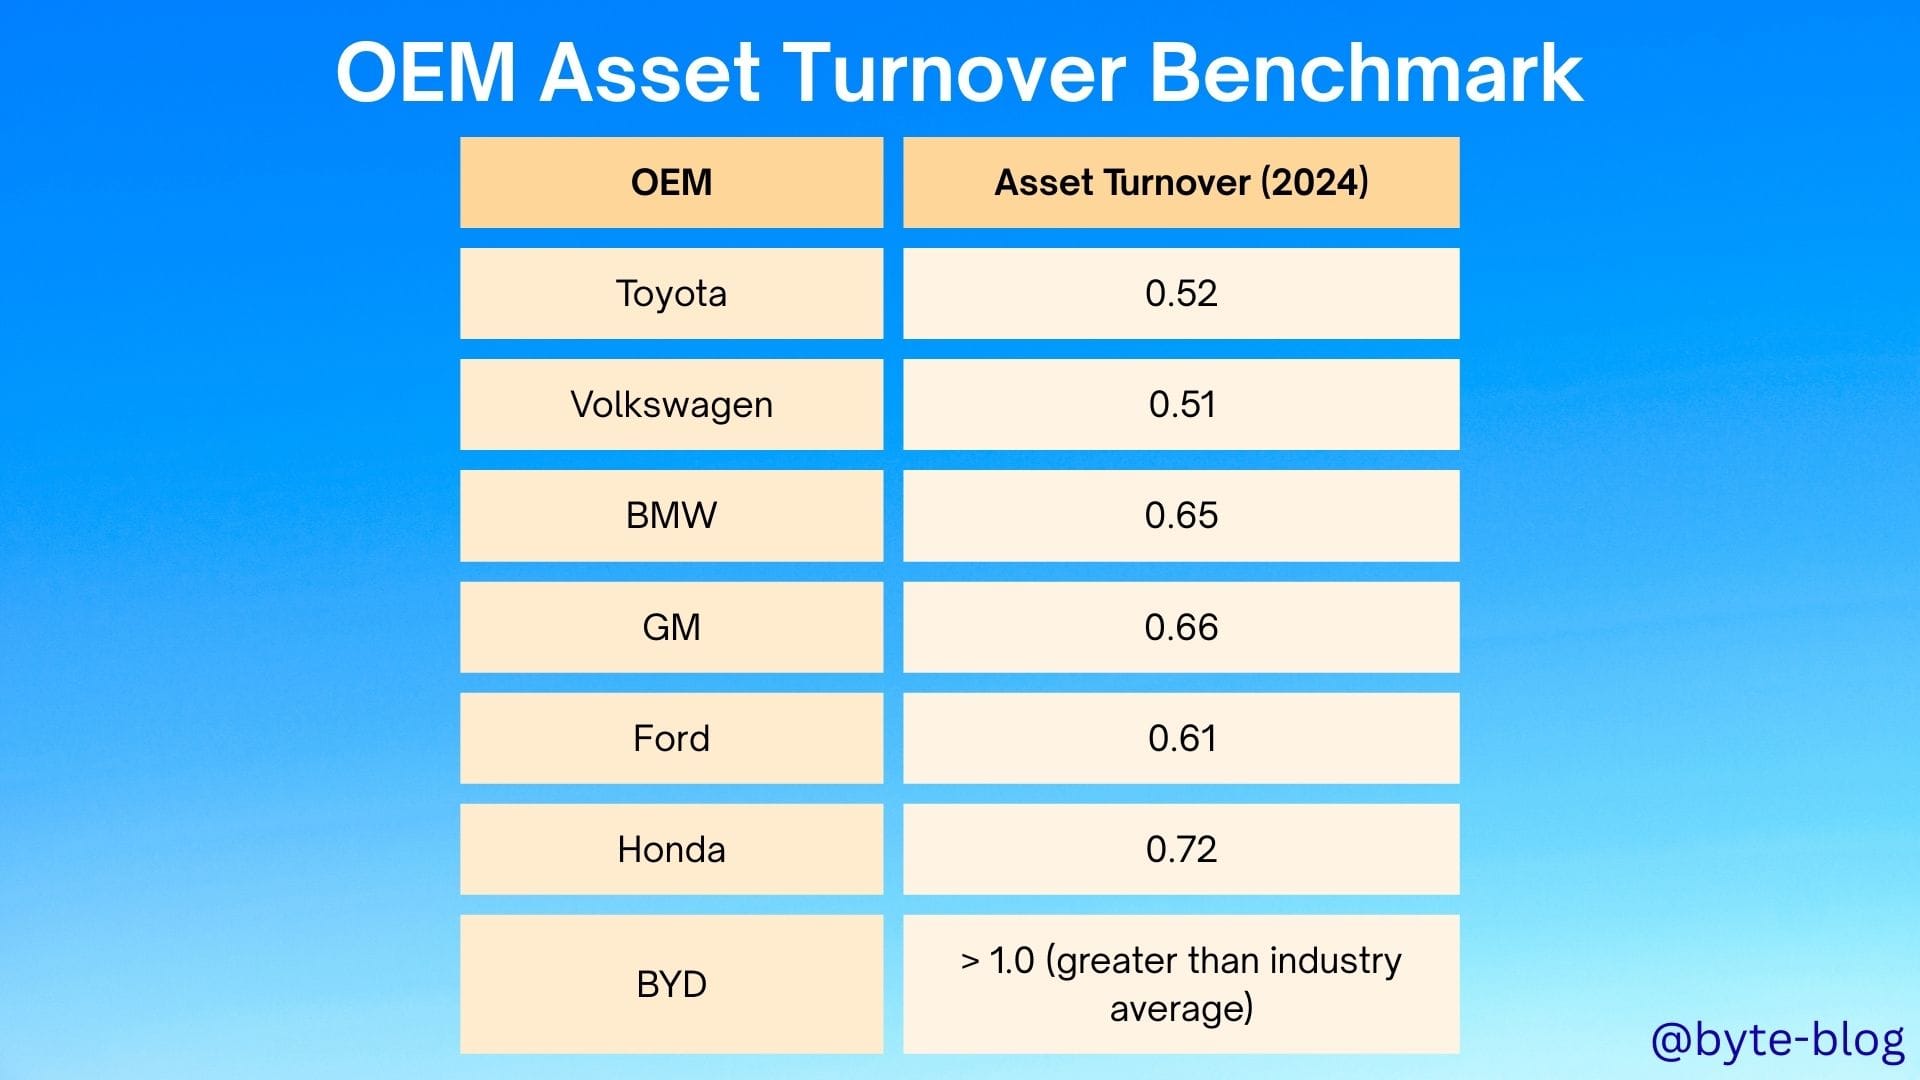
From the above, we can see that :
- The asset turnover ratio is mostly below 1 for the established players in the OEM value chain. This is mainly due to high asset base & revenue in a highly competitive industry which keeps the ratio below 1.
- Efficient / lean automakers & aggressive entrants like BYD can exceed industry benchmarks. We will get into that in a subsequent section below.
Why is asset turnover important? This is closely correlated to another efficiency metric which is Capacity Utilization.
Capacity Utilization
Companies invest in manufacturing facilities & incur fixed costs & depreciation to maintain those assets. Asset turnover ratio shows how efficiently these assets are being utilized to generate revenue or sales.
Capacity utilization ratio shows what percentage of those assets are actually being utilized. It is defined as below:
Capacity Utilization refers to the manufacturing & production capabilities that are being utilized by a nation or enterprise at any given time. It is the relationship between the output produced with the given resources & the potential output that can be produced if capacity was fully used. (Source : here)
The mathematical formula for calculating capacity utilization is :
Capacity Utilization = (Actual Level of output / Maximum Level of output) * 100
For e.g., if a company can produce 100,000 units of an item (Maximum level of output) & it is now producing 50,000 units (actual output), the company's capacity utilization is
(50,000 / 100,000) * 100 = 50%
I would like to highlight one key point - the higher the capacity utilization, the lower the cost per unit of output.
This means that the fixed costs which goes towards maintaining the huge capital investments & assets (Plant & Machinery, factories, manufacturing facilities etc) is absorbed by a larger volume of output which in turn reduces the cost per output unit.
But 100% capacity utilization is not practical due to
- Essential downtime for repairs
- Changeovers to switch production lines for different models, colors etc
- Supply chain variability
- Quality control requirements
- Need for operational flexibility to manage demand fluctuation
- Employee requirements - Work scheduling, labor mandates, training requirements etc.
Before we get into the numbers, we have to note that capacity utilization numbers are not routinely disclosed by most OEMs as part of their annual reports, investor presentations etc. Instead, analysts, researchers, and trade authorities derive these benchmarks using a combination of indirect data, industry surveys, regulatory filings, and targeted plant-level disclosures. (Sources : cited under "References & Citations")
Before we get into the capacity utilization numbers, let us get into another efficiency ratio - Inventory Turnover Ratio.
Inventory Turnover Ratio
The inventory turnover ratio is a financial ratio showing how many times a company turns over it's inventory in a given period, typically a fiscal year. (Source : here)
Why is this ratio important? For any manufacturing entity, it is important that whatever product is manufactured, it is quickly sold & revenue generated instead of it lying in storage facilities or godowns for an inordinate amount of time.
It shows how operationally efficient the company is in manufacturing what is expected to be sold in line with demand instead of
- manufacturing more than the demand resulting in lots of inventory lying around or
- manufacturing less than the demand resulting in inventory being out of stock & customers going to competitors
How is inventory turnover ratio calculated? The formula is
Inventory Turnover Ratio = (COGS / Average Value of Inventory) * 100
where COGS = Cost of Goods Sold
Higher the ratio, the better it is as it signifies that inventory produced is being sold faster which results in faster revenue or sales while lower ratio signifies lower sales or overstocking of inventory.
Just looking at the ratio per se does not help in analysis. It has to be seen in context of the industry, external economic environment, supply chain issues etc which may force certain industries to maintain higher stock than warranted to hedge against the risk of running out of inventory.
OEM Efficiency Benchmark
Let us now include Capacity Utilization, Inventory turnover ratio & Cost to income ratio (which we discussed last week) in our table :
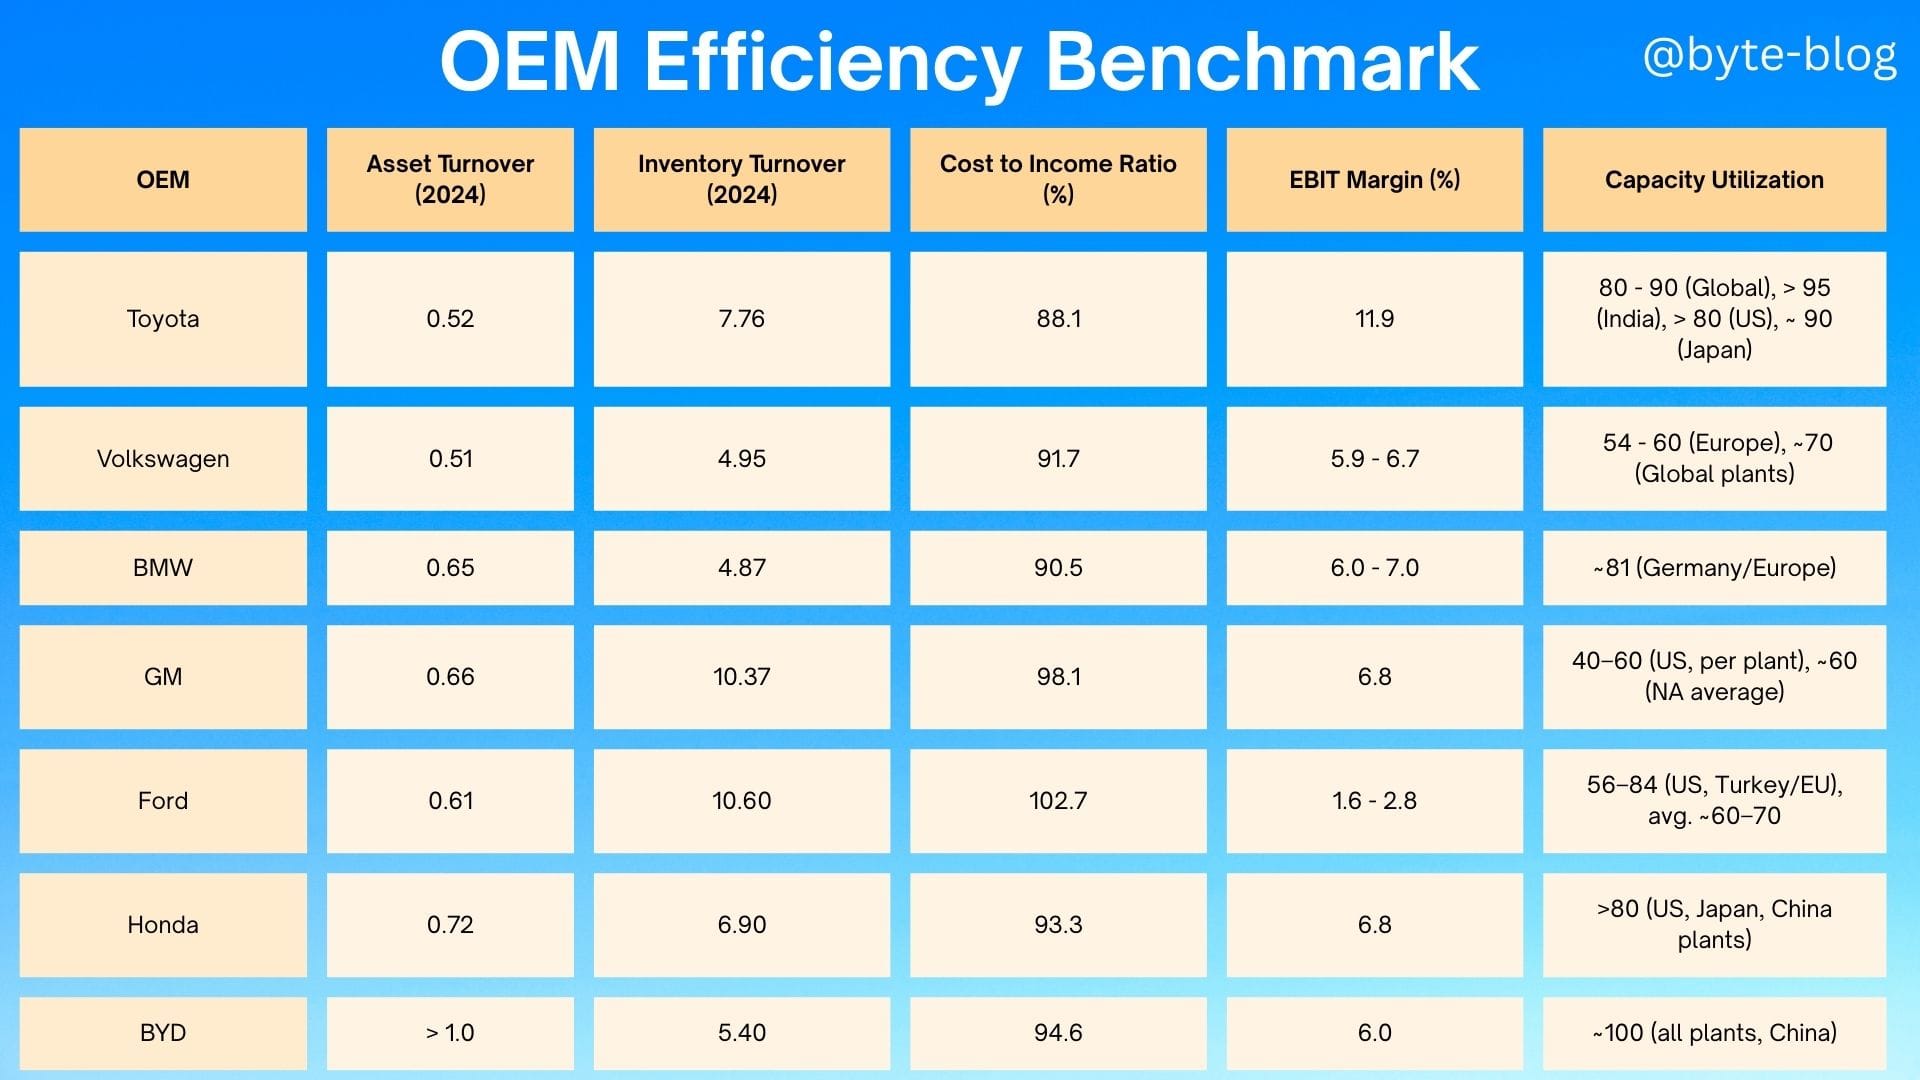
Of course, there are lot of other KPIs we can get into but we will focus on the above as this provides a high level picture without getting weighed down by too much numbers.
Each individual KPI has to be seen in conjunction with other KPIs among industry peers & the impact ultimately will reflect in EBIT (also included) as increased profits & how efficiently the OEM is run. Now, look at the above table. What do you see?
- Toyota,
- Established OEM with a respectable asset turnover ratio of 0.52%,
- Inventory turnover ratio of 7.76,
- the lowest cost to income ratio among peers at 88.1% &
- Very high capacity utilization
- has the highest EBIT margin of 11.9%.
- This reflects the operational efficiency with which Toyota is running it's operations. Of course, there are other factors like debit to equity ratio & other operational KPIs that we have not covered here.
- BYD
- Aggressive entrant OEM with a significantly higher than industry average asset turnover ratio of > 1.0,
- Inventory turnover ratio of 5.40 (better than Toyota),
- Cost to Income ratio of 94.6%
- Near perfect capacity utilization has an EBIT Margin of 6%
This gave rise to a question in my mind as to why there is this much disparity between BYD & Toyota in EBIT margin despite BYD's better efficiency metrics. Of course, the higher cost to income ratio of BYD could contribute to a certain extent to this variance. But what are the business drivers behind this variance?
After going deep into the question & doing some research, my understanding of the main reasons are as below:
- Positioning & Pricing Strategy - Toyota is an established OEM with multiple segments like hybrids, SUVs, premium segments (Lexus) etc while BYD (also with multiple models) is a new entrant to the market with a different value proposition - EV & PHEV focussed on affordable mass market EVs, especially in China & other emerging markets. It's strategy is to go aggressively after market share more than profits. Their pricing strategy is very competitive with lower margins compared to Toyota which has better pricing power, higher margin & better product mix which results in higher per unit profit for Toyota. (Source : 1 & 2)
- Marketing, R & D & Expansion - BYD spends heavily on R & D, marketing & international expansion due to their mass market strategy & developing new EV technologies to be ahead. Toyota's R & D & marketing expenses, though high, is spread on existing models & focused on established platforms which already delivers high RoI (Return on Investment). Also, Unlike traditional automakers that rely on external parts suppliers, BYD aims to control the entire industrial chain from battery research and development to production of new energy vehicle manufacturing.(Sources : 3 & 4)
- Scale Benefits - Toyota's larger global scale, more mature platforms enable lower fixed costs per vehicle, greater purchasing leverage & more efficient use of plants & R & D. BYD, despite high asset / inventory turnover is expanding rapidly which adds start up costs & limits scale benefits per model compared to Toyota's more mature lines (Source : 3)
Will OEMs like BYD overtake existing incumbents like Toyota in the near future? Are companies like Toyota embodying the past which is subject to disruption while companies like BYD are the ones driving disruption & the future? How will the existing OEMs react to disruption?
We will explore this next week under "Market Maturity & Growth Rate" where we explore the current market state & disruption taking over the automotive industry.
References & Citations
Sources for 2024 Automotive Capacity Utilization Benchmarks:
• News18. “Toyota Set to Hit Full Production Capacity by 2024 Amidst Soaring Demand.” July 23, 2023.
https://www.news18.com/auto/toyota-set-to-hit-full-production-capacity-by-2024-amidst-soaring-demand-8410921.html
• Toyota Motor Corporation. “Sales, Production, and Export Results for 2024 (January–December 2024).”
https://global.toyota/en/company/profile/production-sales-figures/202412.html
• Reuters. “Volkswagen’s labour clash spotlights Europe’s car factory conundrum.” September 25, 2024.
https://www.reuters.com/business/autos-transportation/vw-labour-clash-spotlights-europes-car-factory-conundrum-2024-09-25/
• Volkswagen AG. “Annual Report 2024: Production.”
https://annualreport2024.volkswagen-group.com/group-management-report/sustainable-value-enhancement/production.html
• BMW Group. “BMW Group Plant Regensburg gears up for the future with commissioning of expanded body shop in Neutraubling.” February 28, 2025.
https://www.press.bmwgroup.com/global/article/detail/T0448612EN
• UAW. “Unlocking the Potential of U.S. Auto Manufacturing Capacity.” April 2025.
https://uaw.org/wp-content/uploads/2025/04/2025-UAW-extra-capacity-white-paper-A1FINAL-1.pdf
• Ford Otosan. “Production and Capacity.”
https://www.fordotosan.com.tr/en/operations/production/production-and-capacity
• Tacirler Investment. “Ford Otosan Company Update, August 2024.”
https://tacirler.com.tr/upload/files/arastirma/sirket-raporlari/froto/froto_companyupdate_august_2024.pdf
• Fourin Inc. “Honda Motor’s Global Production Capacity of Automobiles.” July 14, 2022.
https://aaa.fourin.com/reports/0d4191f0-0410-11ed-9518-1739edbe001c/honda-motors-global-production-capacity-of-automobiles
• Honda Motor Co., Ltd. “Summary of 2024 Honda Business Briefing on Direction.” June 5, 2024.
https://global.honda/en/newsroom/news/2024/c240516eng.html
• CnEVPost. “BYD boosts production capacity by nearly 200,000 units in Aug-Oct.” November 4, 2024.
https://cnevpost.com/2024/11/04/byd-boosts-capacity-200000-aug-oct/
• Best Selling Cars. “2024 (Full Year) Global: BYD Worldwide Car Sales and Productions.” January 15, 2025.
https://www.best-selling-cars.com/brands/2024-full-year-global-byd-worldwide-car-sales-and-productions/
Toyota:
• Financial Summary, FY2024:
https://global.toyota/pages/global_toyota/ir/financial-results/2024_4q_summary_en.pdf
• Full IR Library:
https://global.toyota/en/ir/library/
Volkswagen Group:
• Annual Report & Full Year Results 2024:
https://www.volkswagen-group.com/en/annual-report-and-full-year-results-2024-19005
BMW Group:
• BMW Group Report 2024:
https://www.bmwgroup.com/en/report/2024/index.html
GM (General Motors):
• SEC 10-K 2024 (HTML):
https://www.sec.gov/Archives/edgar/data/1467858/000146785825000032/gm-20241231.htm
• GM Investor Relations (earnings & statements):
https://investor.gm.com/financial-information/annual-reports/default.aspx
Ford:
• Ford Financial Results (Investor Relations):
https://shareholder.ford.com/investors/financials/quarterly-results/default.aspx
• AlphaQuery Ford EBIT Data:
https://www.alphaquery.com/stock/F/fundamentals/annual/ebit
Honda:
• FY2024 Financial Presentation PDF:
https://global.honda/en/investors/news/news202405107/main/0/link/FY202403_4Q_financial_presentation_script_e_1.pdf
• Honda Global Investors/Results:
https://global.honda/en/investors/library/financialresult/
BYD:
• BYD Official Investor Relations Reports:
https://www1.hkexnews.hk/listedco/listconews/sehk/2025/0324/2025032401238.pdf
• BYD Global Investor Center (historical and latest):
https://www.bydglobal.com/cn/en/BYD_ENInvestor/InvestorAnnals_mob.html