Strategy Byte - Week 64 The Journey so Far Part IV

Table of Contents
- Term Structure / Yield Curve
- Debt Security
- Bonds
- Yield Curve Relevance
We continue our journey to understand strategy by looking back & reviewing our steps which will help us to gain perspective on the subject & also guide us moving forward.
Last week we reviewed Foreign Exchange Rate which is a critical component in international trade & it's relationship with movements in interest rates & relative inflation rates.
With interest rates, we see that normally longer tenor loans or deposits have higher interest rates compared to shorter tenor loans or deposits. For e.g., demand deposits (where customers can withdraw funds at will - savings, current account) have lower interest rates while fixed deposits have higher rates (longer the tenor, higher the rates). Why?
That is because it is based on what we call the Term Structure or Yield Curve which we explored in Week 25.
Term Structure / Yield Curve
The yield curve, also called the term structure is
The relationship between the remaining time-to-maturity of debt securities & the yield on those securities (Source : here)
What does the above mean?
Let us take one step back & understand what is debt securities?
Debt Security
A debt security is a type of financial asset that is created when one party lends money to another
Bond
Now that we defined debt security, let us understand what is a Bond.
Bonds are debt securities issued by Corporations, Governments or other organizations & sold to investors. (Source : here).
For e.g.,
a. Government Bonds - Bonds issued by Governments to finance their activities.
b. Municipal Bonds - Issued by local municipalities, cities etc to finance their infrastructure such as roads, bridges etc.
c. Corporate Bonds - Bonds issued by companies to raise capital for their activities like expansion or acquisition.
For context, the size of the bond market is as below :
The global bond market was valued at USD 120.58 trillion in 2025 and estimated to grow from USD 127.36 trillion in 2026 to reach USD 167.52 trillion by 2031, at a CAGR of 5.62% during the forecast period (2026-2031). (Source : here)
Along with Central Banks, commercial banks are key players in the Bond market.
So, we can see the enormity of the bond market & it's sheer size which has a major impact on economies around the world.
With that in mind, let us now understand what is Term structure or Yield Curve.
In simple terms, it just means a line graph showing the relationship between the remaining period for a bond to mature & their yields. The maturities are plotted across the x-axis while the yields are plotted across the y-axis. For e.g.,
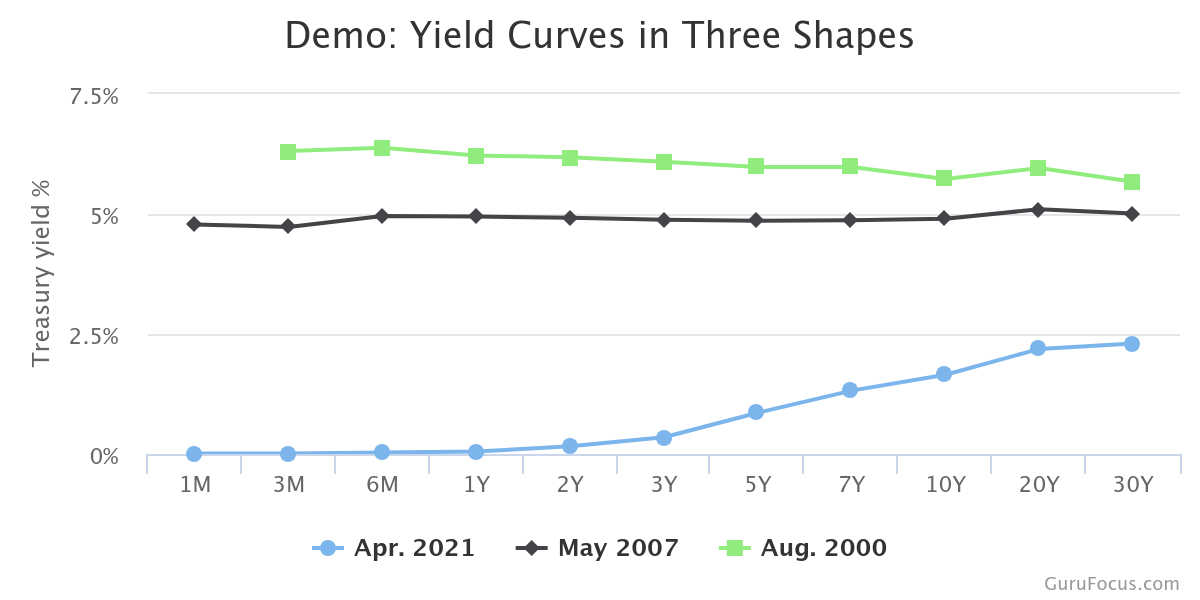
(Source : here)
The above line chart shows the interest rates or yields of bonds across various maturities. Why are there three lines? That is because, the yield is drawn as of three reference periods - as of April 2021, May 2007 & Aug 2000 where the graphs show different slopes. Why? We will explore it in "Economic Outlook" below.
Yield Curve Relevance
It is not enough that we have a good strategy in place. There needs to be funding & capital allocation mechanisms in place to implement that strategy.
In any strategic decision which involves additional investments or borrowing, understanding the economic outlook as well as the direction in which interest rates are expected to move (expectation) is critical. It impacts borrowing costs, capital allocation & investment decisions.
There are two aspects to consider when understanding the relevance of yield curve :
- Economic Outlook
- Market Expectations
Economic Outlook
The Yield curve is an important tool when trying to understand the economic outlook. Let us understand how by seeing what signal each type of yield curve provides :
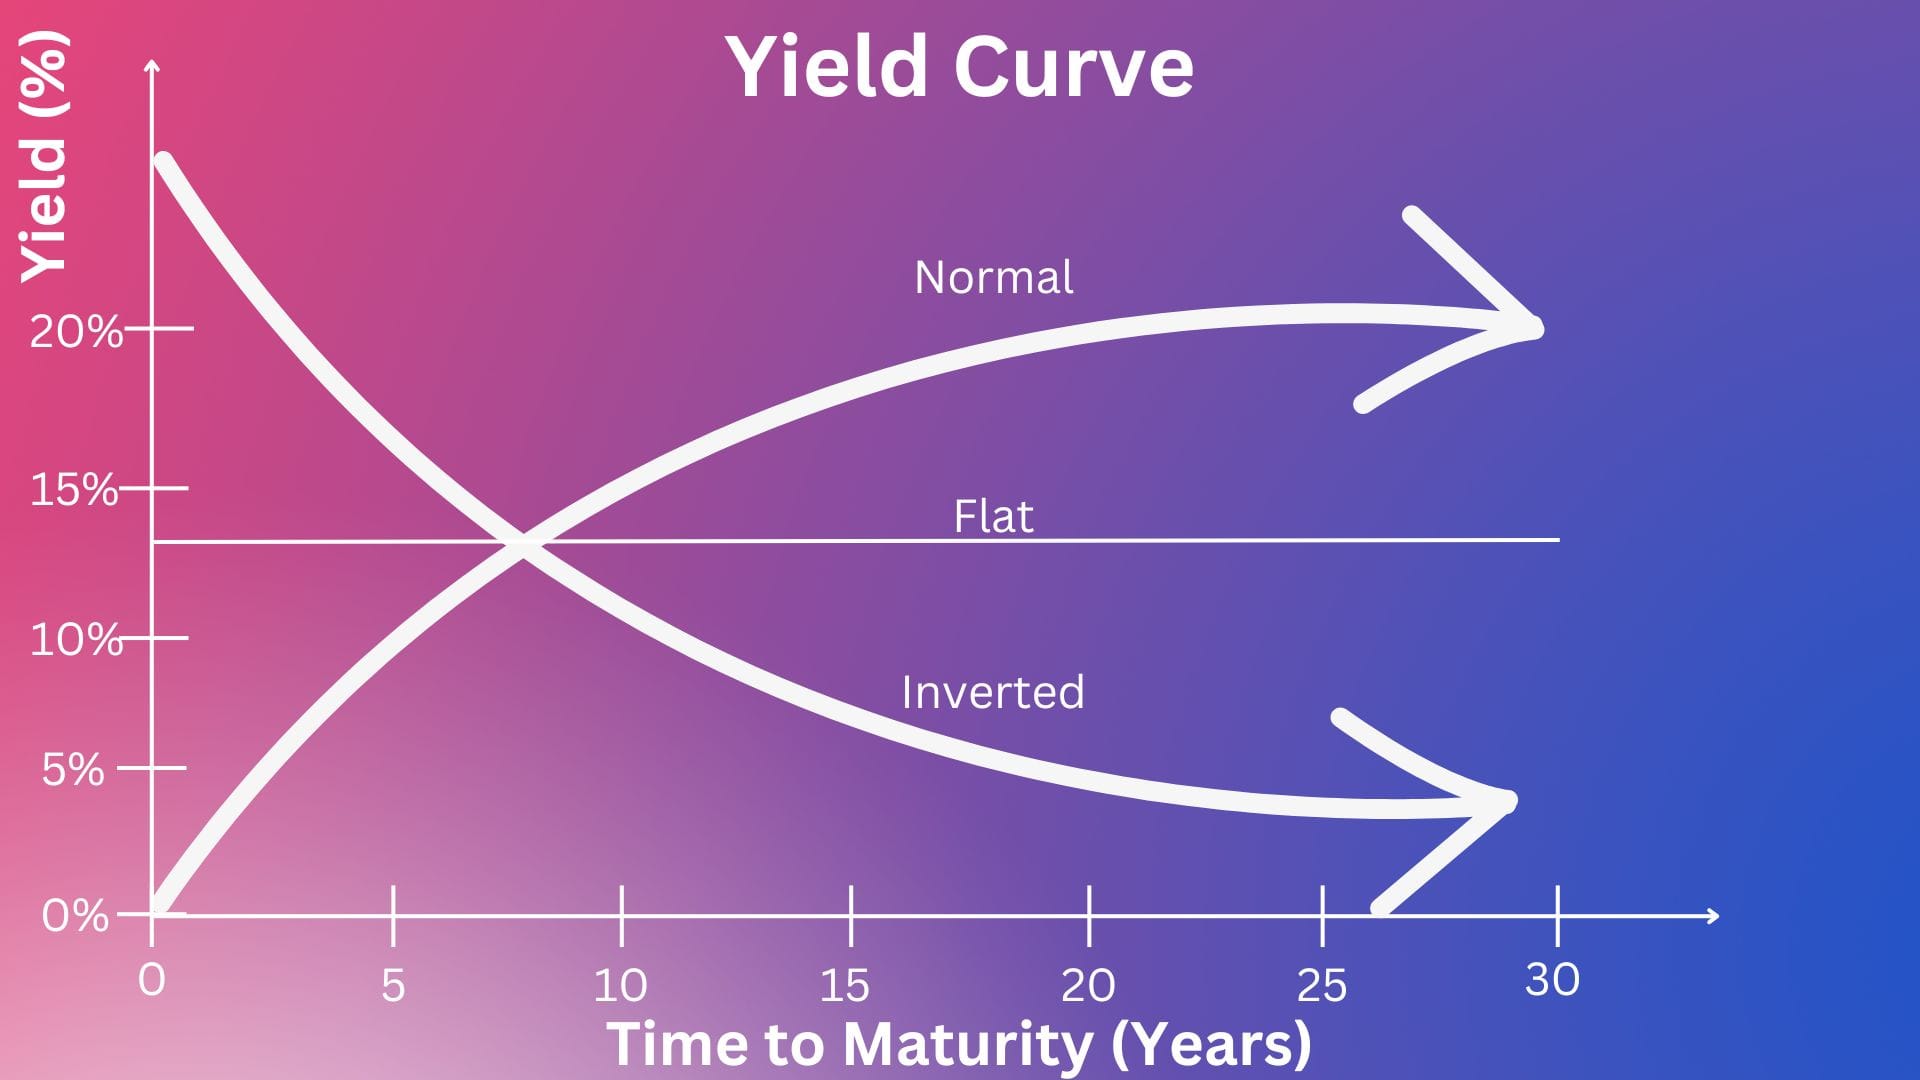
- Normal / Upward Sloping Yield Curve - An upward sloping yield curve indicates that investors expect long term interest rates to be higher which is associated with a strong positive outlook for the economy. This also means that inflation outlook is also higher as a result of a stronger economy. This is correlated to the start of an expanding economy.
- Flat Yield Curve - A flat yield curve indicates that investors expect long term interest rates to remain at the same level as the short term rates without any significant increase in the future. This indicates uncertainty about the economy & worries about a potential recession without tipping into one.
- Inverted Yield Curve -
- An inverted yield curve indicates that investors expect long term interest rates to be lower than the short term rates. Stable or falling long term rates typically happens when an economy slows. Investors believe current growth is stronger than future growth. Historically, an inverted yield curve has been a reliable predictor of recessions.
- As per Cleveland Fed, the rule of thumb is that an inverted yield curve indicates a recession in about a year, & yield curve inversions have preceded each of the last eight recessions. One of the recessions predicted by the inverted yield curve was in 2020. The Yield curve inverted in May 2019, almost a year before the most recent recession which started in March 2020.
- There has been two notable false positives too - an inversion in late 1966 & a very flat curve in late 1998 (Source : here)
However, as there are multiple factors & policy stances taken by Central Banks impacting an economy & it's outlook, the yield curve along with several other factors must be considered when forecasting economic outlooks.
A simplified visual of the above three types of yield curves is shown below:
The below excerpt from Cleveland Fed explains this clearly (Source : here)
- Background: The yield curve—which measures the spread between the yields on short- and long-term maturity bonds—is often used to predict recessions.
- Description: We use past values of the slope of the yield curve and GDP growth to provide predictions of future GDP growth and the probability that the economy will fall into a recession over the next year.
| January | December | November | |
|---|---|---|---|
| 3-month Treasury bill rate (percent) | 3.67 | 3.63 | 3.94 |
| 10-year Treasury bond rate (percent) | 4.19 | 4.15 | 4.11 |
| Yield curve slope (basis points) | 52 | 52 | 17 |
| Prediction for GDP growth (percent) | 3.3 | 3.0 | 3.0 |
| Probability of recession in 1 year (percent) | 16.0 | 17.1 | 21.4 |
Market Expectations
The Yield curve reflects market expectations of future interest rates providing insights into the minds of investors as to their outlook on the economy.
Next week, we move forward with the environmental variables that drive interest rates & inflation - two very important economic drivers.