Finance Byte - Week 10 Contribution Analysis

Table of Contents
- Recap
- Cost Behavior
- Contribution
- Contribution Margin
Recap
During Week 9 of Finance Bytes, we analyzed performance at gross level or gross performance which means activities resulting in revenue & costs from the core business before considering indirect activities & costs.
The net result from direct level activities is called "Gross Profit" or
Net Sales - Cost of Sales = Gross Profit
This number shows how efficiently a company manages it's production or direct activities, meaning pricing, volume, direct costs (raw material, inventory, shipping etc) in a way that results n positive gross profit.
We then analyzed the line items in the income statement (from top to bottom) under :
- Level 2A - Operating Income
- Level 2B - Net Income
Level 2A - Operating Income
The net result of reducing indirect expenses (or selling / operating expenses & General / Administrative expenses) from Gross Profit is called Operating Income.
Operating income, also referred to as operating profit or Earnings Before Interest & Taxes (EBIT), is the amount of revenue left after deducting the operational direct and indirect costs from sales revenue. (Source : here)
Level 2B - Net Income
Net income is a company’s profits or earnings. Net income is referred to as the bottom line since it sits at the bottom of the income statement and is the income remaining after factoring in all expenses, debts, additional income streams, and operating costs. The bottom line is also referred to as net income on the income statement.
Net income is calculated by netting out items from operating income that include depreciation, interest, taxes, and other expenses. Sometimes, additional income streams add to earnings like interest on investments or proceeds from the sale of assets. (Source : here)
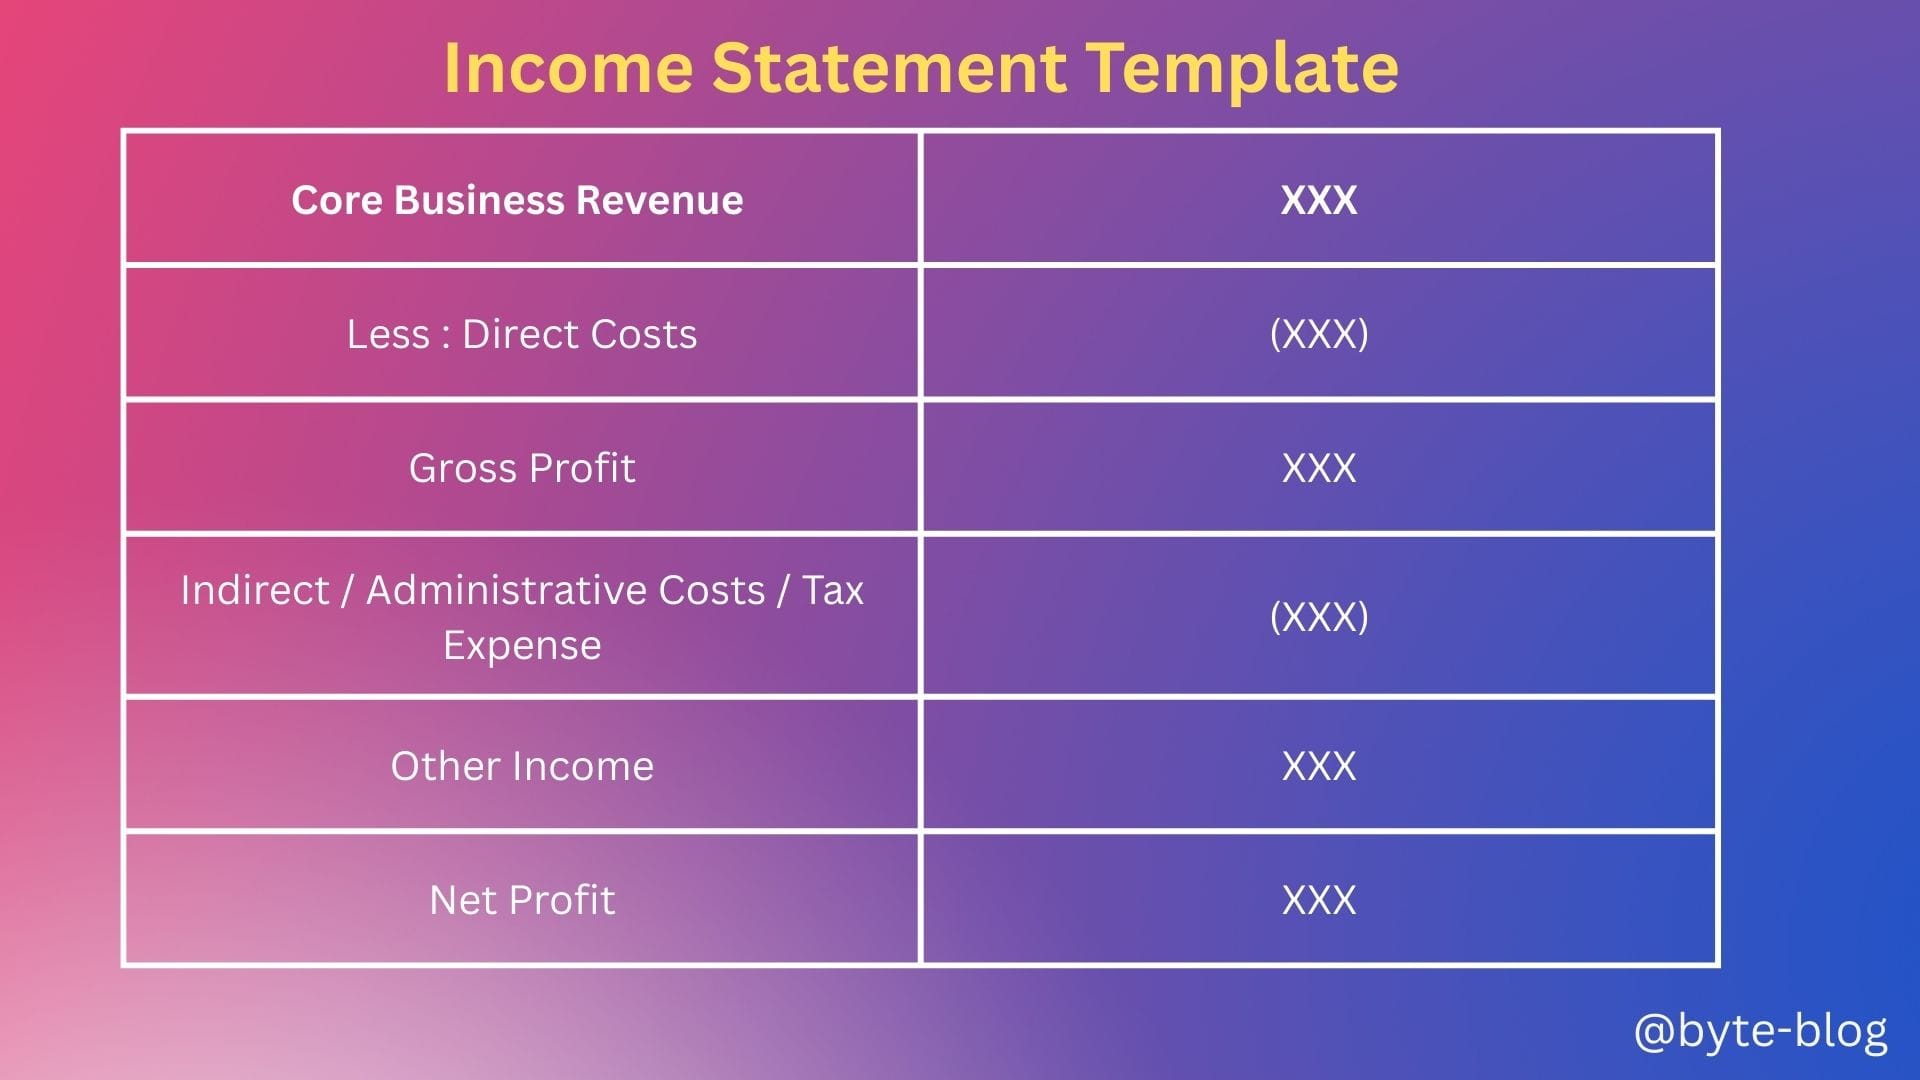
So, if we go from top-line to bottom-line of any income statement, a typical income statement generally looks like (Disclosures typically depend on local disclosure rules & GAAP standards):
Now, Jack knows his income / expenses & whether he is making a profit or loss. How will Jack work towards making his business profitable or increasing the profitability levels of his business? All businesses start with a loss because expenses start kicking in first before any business starts earning their first dollar of revenue. Depending on the business, it can be also be years.
How will Jack know when will his business turn from loss to profit, what is the turning point? What analysis will help him in his decision making?
For this Jack needs to understand his cost behavior & breakup. He also needs to understand something called product contribution. What does this mean? Let's dive in...
Cost Behavior
Let us rewind back to Week 5 where we explored "Coffee Costing". There, we bifurcated costs based on their behavior into :
- Variable Costs &
- Fixed Costs
We defined Variable Costs as :
Expense that changes in proportion to how much a company produces or sells. Variable costs increase or decrease depending on a company's production or sales volume - they rise as production increases & falls as production decreases.
E.g., raw materials are purchased or procured in line with production volumes. Hence, raw material costs are considered as variable costs. Such costs increase when production or sales increase & decrease when production or sales decrease.
We defined Fixed Costs as :
Expense that normally doesn't change with with an increase or decrease in the number of goods produced or sold by the business.
E.g. Rent costs remain the same whether the company produces 10 units, 100 units, 10,000 units or no units. Rental expenses are based on contractual obligations & hence is considered as fixed costs.
These costs mostly vary with time & generally is independent of units sold.
(In real life however, such classification is not exactly black & white and we will see why over the next couple of weeks)
With the above in mind, let us now understand Contribution Analysis.
Contribution
We know Jack sells coffee at his cafe. Overall, the business has to end in a net profit but for decisions on how & where to act to increase profitability, there are different pressure points in the business & contribution analysis helps to understand those pressure points.
If Jack focuses on those points, decisions taken will have maximum impact to increase profitability.
At his cafe, the unit item sold is a cup of coffee. First thing to keep in mind is the costs that go to make that one cup of coffee. For our analysis, let us classify them under
- Raw material costs (Milk, coffee grains, sugar etc)
- Conversion costs (Barista salary, mixing costs etc)
- Packing Costs for cups / lids (Plastic, cardboard, labor costs for packaging etc)
Let us explore some numbers for one cup of Matcha Latte. Assume the above numbers are :
- Raw material costs = $ 2.oo
- Conversion Costs = $ 3.50
- Packing Costs = $ 1.50
So, to make one cup of Matcha Latte to go, it costs Jack $ 7.oo. So, at the first level, he needs to ensure his selling price per cup of Matcha Latte covers his variable costs ($ 7.00). That means he has to price it accordingly.
(Side Point - Pricing is not something that can be done by just adding margin to costs to make a profit. It has to consider market realities, something we will cover in Strategy Bytes).
Let us assume he sells a Matcha Latte for $ 10.00. This means he makes $ 3.00 per cup which covers his variable expenses.
The $ 3.00 that he makes after reducing variables costs is called Contribution.
Why is this important? We will understand in the next section - Breakeven Analysis but before that, let us define contribution.
When you make a product or deliver a service & deduct the variable cost of delivering that product or service, the leftover revenue is called Contribution. (Source : here)
Assuming the sales price & variable costs per unit remains the same, let us see how much contribution Jack makes from his monthly sales of Matcha Latte from Jan 2025 to June 2025 as below :
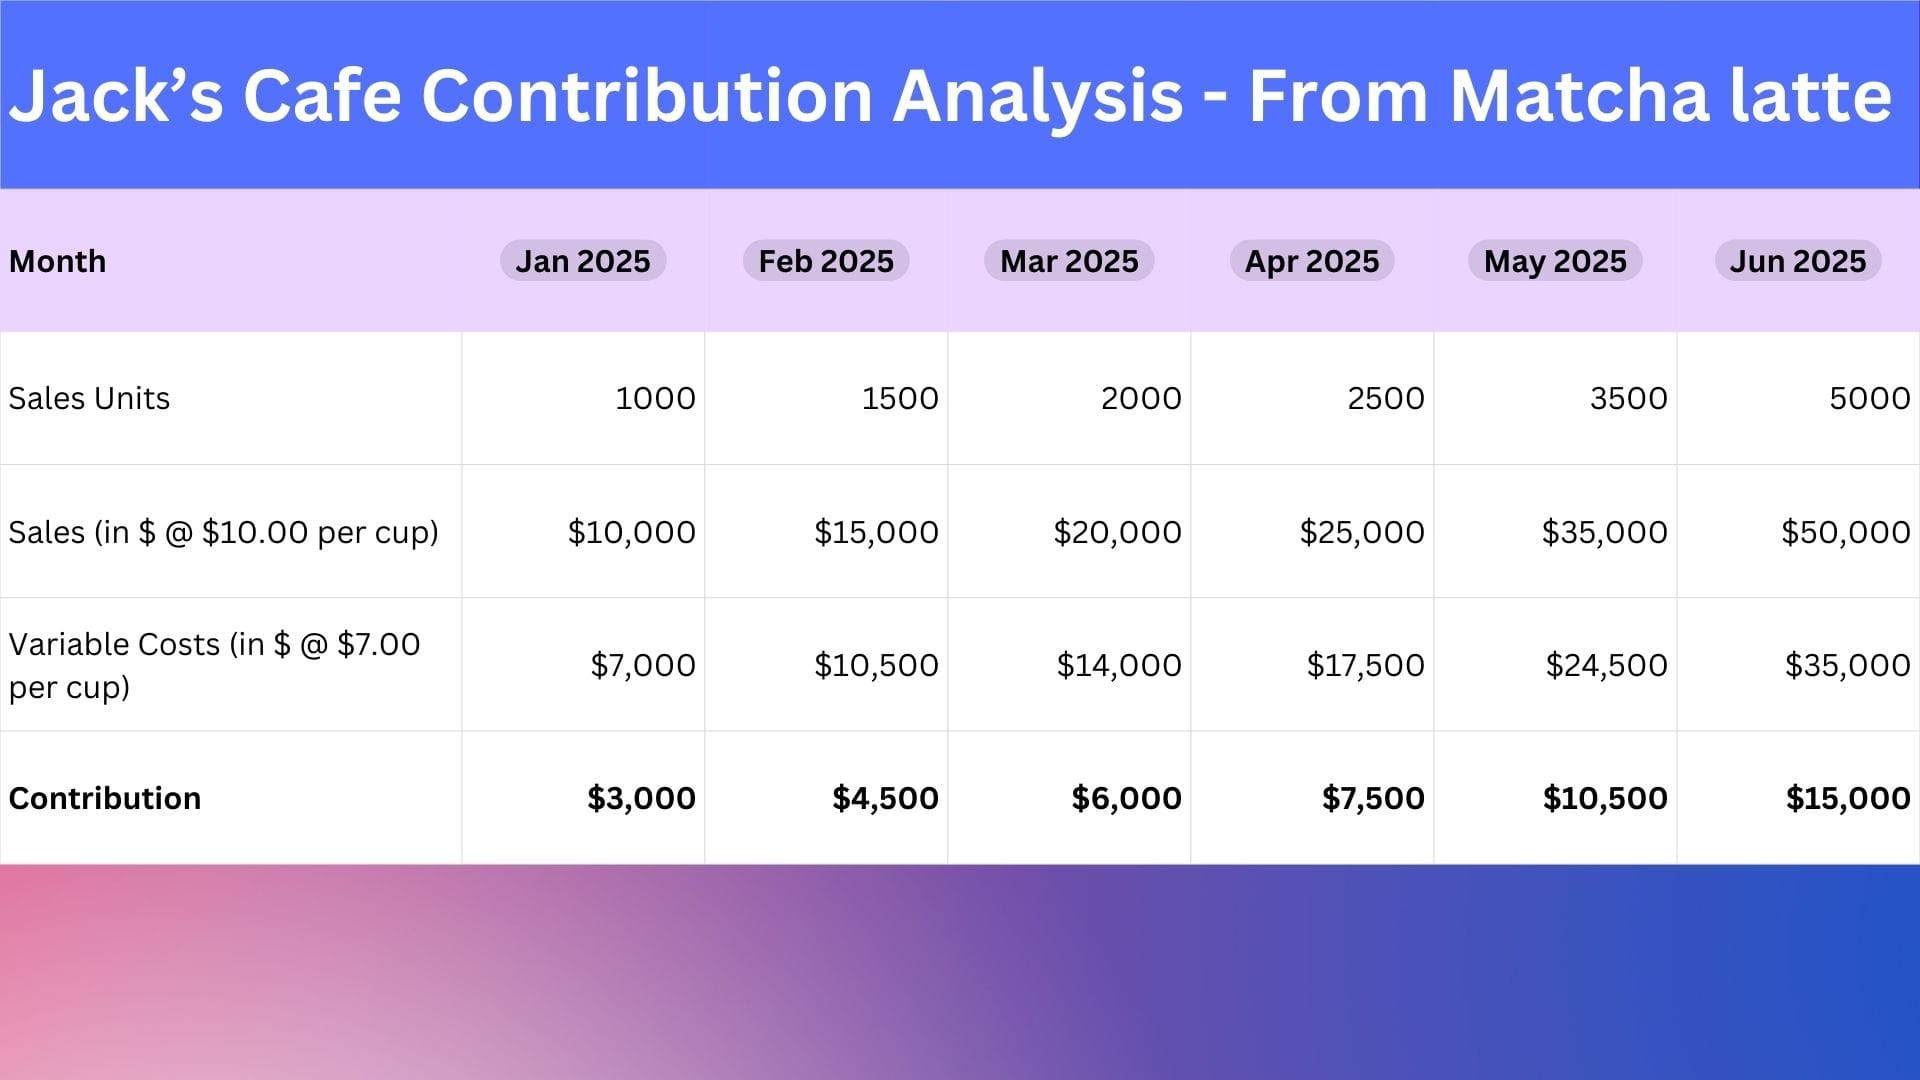
We can see that the more cups he sells, the higher is his contribution from sales of Matcha Latte.
We have to understand one more term before we move on to the next stage. This term is "Contribution Margin".
Contribution Margin
If we divide contribution by the revenue or sales expressed as a %, it is called Contribution Margin. For example, Jack's contribution margin is
Contribution Margin = (10 - 7) / 10 = 30%
So, Jack earns a contribution margin of 30% from sale of Matcha Latte.
The above assumption may or may not remain as variable costs can change over time due to increase in price of materials or labor and pricing needs to be revised to reflect such realities to maintain the margin.
Next week, we understand how contribution analysis along with breakeven analysis helps Jack to analyze & increase overall profitability from his cafe.
