Finance Byte - Week 13 Breakeven Analysis

Table of Contents
- Recap
- Start Up Costs
- Breakeven Analysis
Recap
During Week 12 of Finance Byte, we discussed Cost structure & behavior. Understanding cost structure along with how it behaves is very important for every business owner to identify how & where they can move the needle to become more cost efficient & influence their product mix & pricing accordingly to increase profitability.
We started with the problem any business owner like Jack faces to get their businesses to grow with sustained profits & the two things they need to get a grip on are:
- Reducing costs & introducing cost efficiencies into their operations
- Optimizing product mix to increase revenue & profitability by selling more products with higher contribution margin
But to reduce costs or introduce cost efficiencies, it is important to understand cost structure.
Cost structure is the breakdown of expenses incurred by a business in it's operations. It refers to various costs associated with production & delivery of goods & services.
Understanding cost structure is critical for a business owner to understand profitability & efficiency of their operations.
Then we explored Cost Behavior which is the variability of costs in line with activity levels of a business.
Then we differentiated between how items of cost are classified in the income statement vs classifying costs based on their behavior as visualized below:
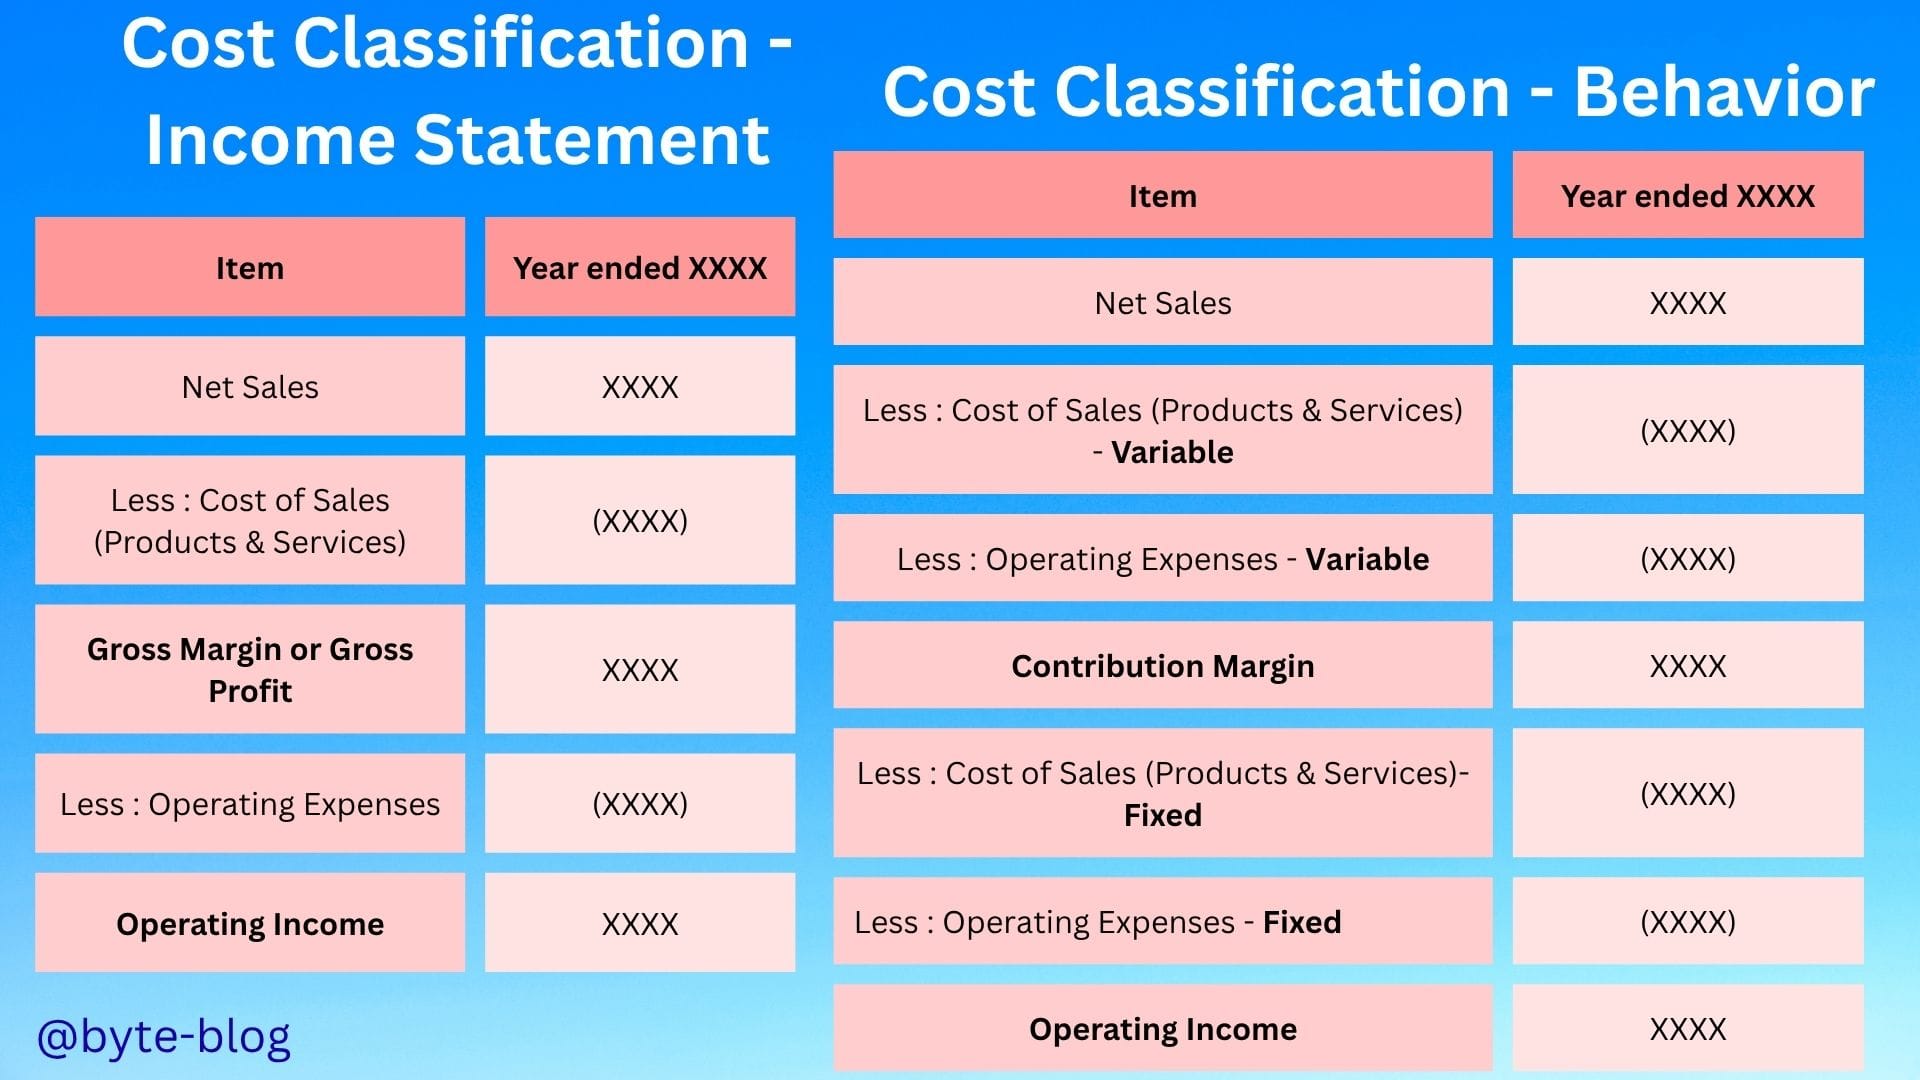
The table on the right classifies costs as variable or fixed which gives our cafe owner Jack more clarity for decision making.
Before we get into the numbers, let us understand one more concept which is a logical follow to cost behavior & structure - Breakeven Analysis
Start up Costs
Before we get into the technical explanation of breakeven analysis, let us understand the underlying concept with a simple example :
When Jack started his cafe, he had to incur costs related to start up & initial operations. Let us see some of them below (with made up numbers) :
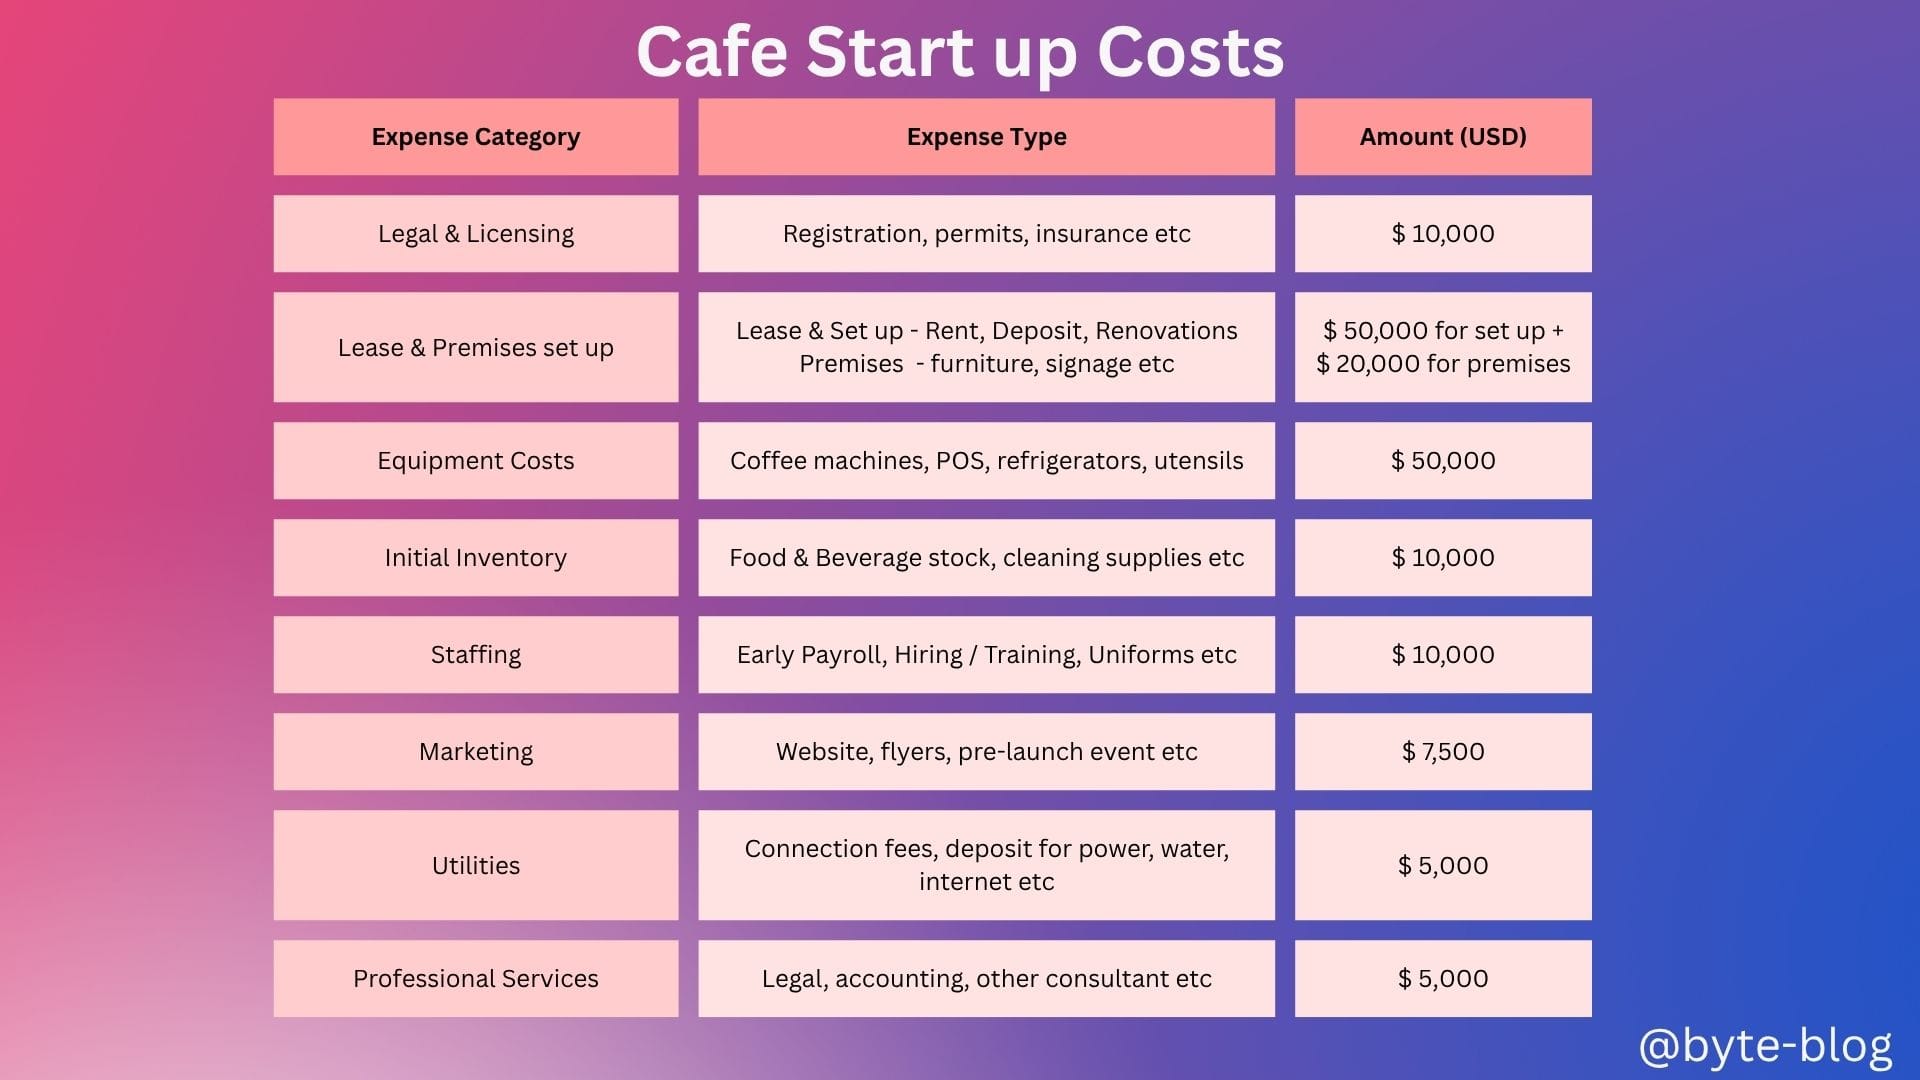
Now, to go forward with our analysis, we have to consider only those spends which will impact the income statement or Operating Expenses. This was discussed in Week 6, where we defined two types of expenses :
- Operating Expenses - or Opex refers to costs incurred by a business for it's operational activities. In other words, operating expenses are costs that a company must make to perform it's operational activities
- Capital Expenses - or Capex refers to the funds used by businesses to purchase long-term assets intended over continued use. The asset is purchased to generate revenue from that asset over multiple years.
We will deep dive into capital expenses later & focus on operating expenses for now.
Jack has to spend these amounts even before he sells a single cup of coffee or any other product in his menu. So, any start up owner always starts their business with a loss in their income statement.
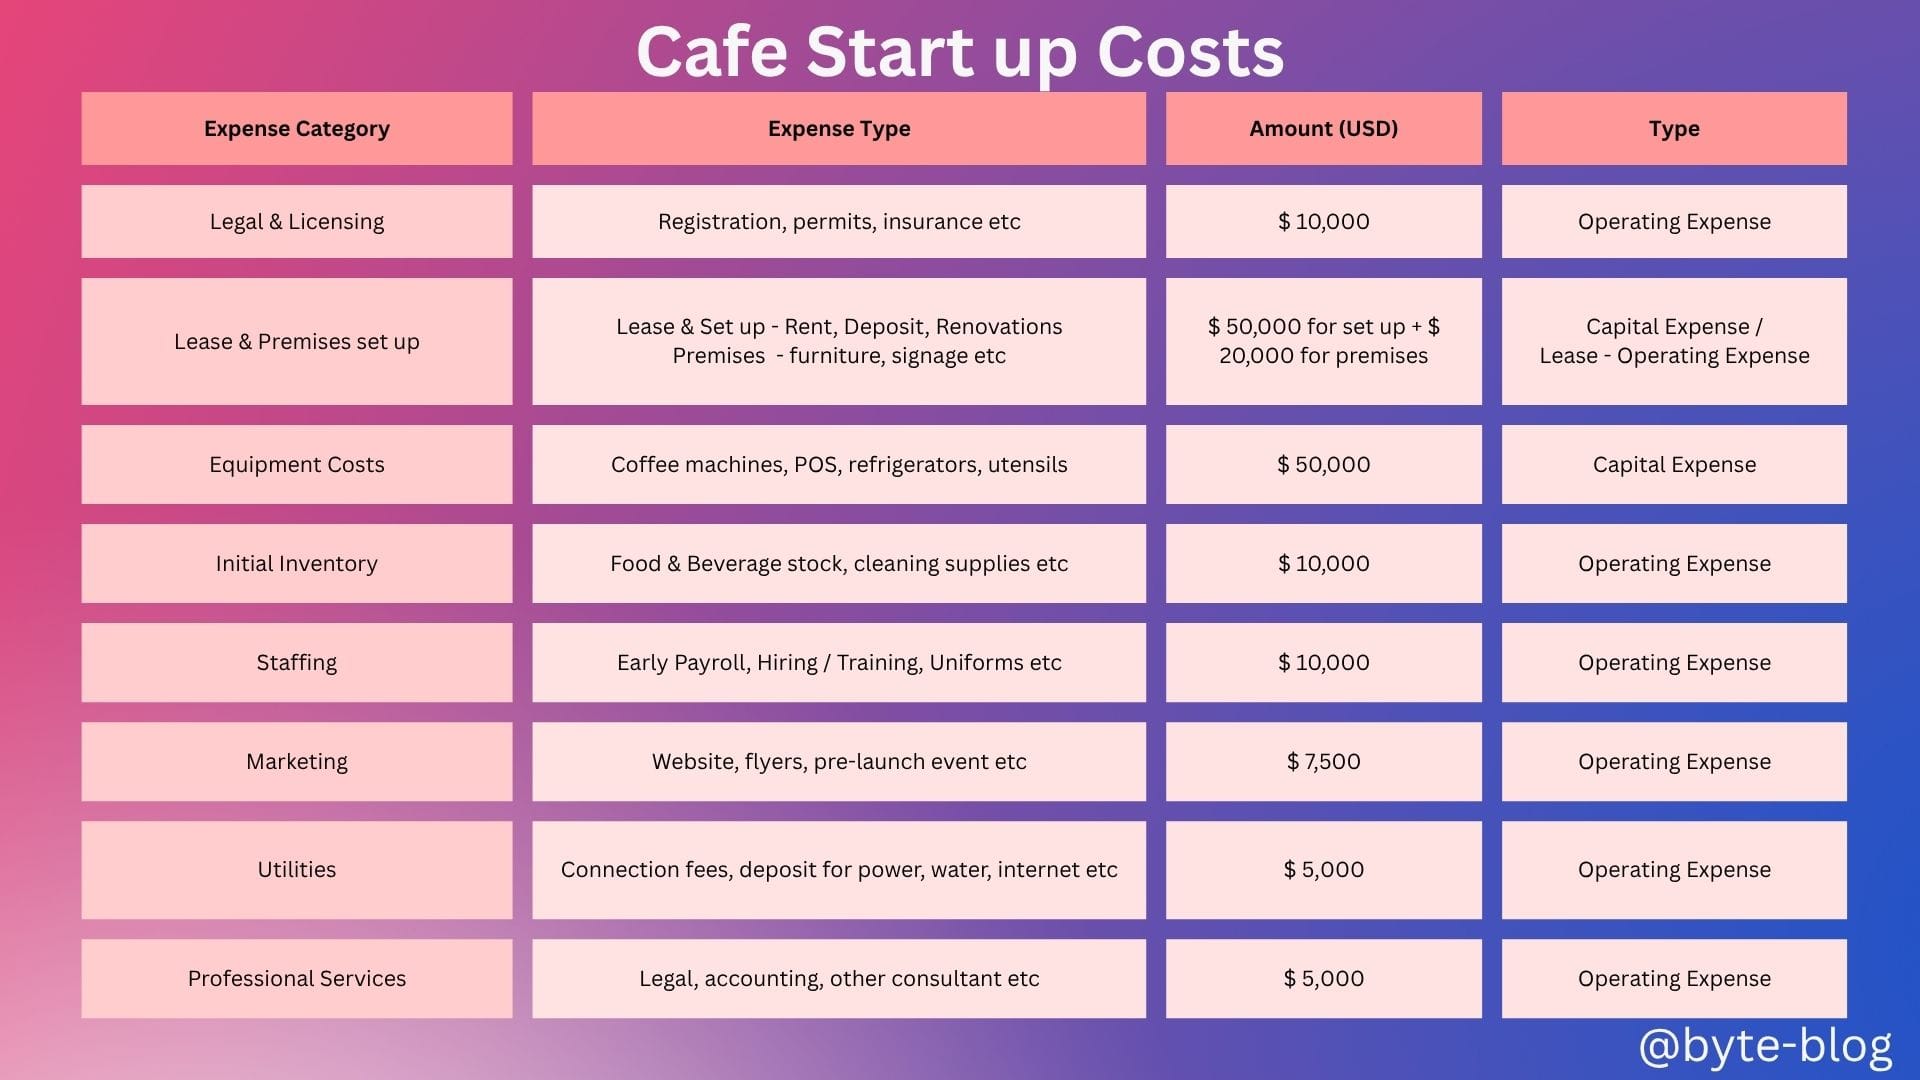
Let us next classify the above expenses into Capital or Operating Expenses.
How will Jack's income statement look like? For simplicity sake, let us assume he spends the operating expenses equally over five months (though that is not how it is in real life!!).
Below is his income statement extract over five months :
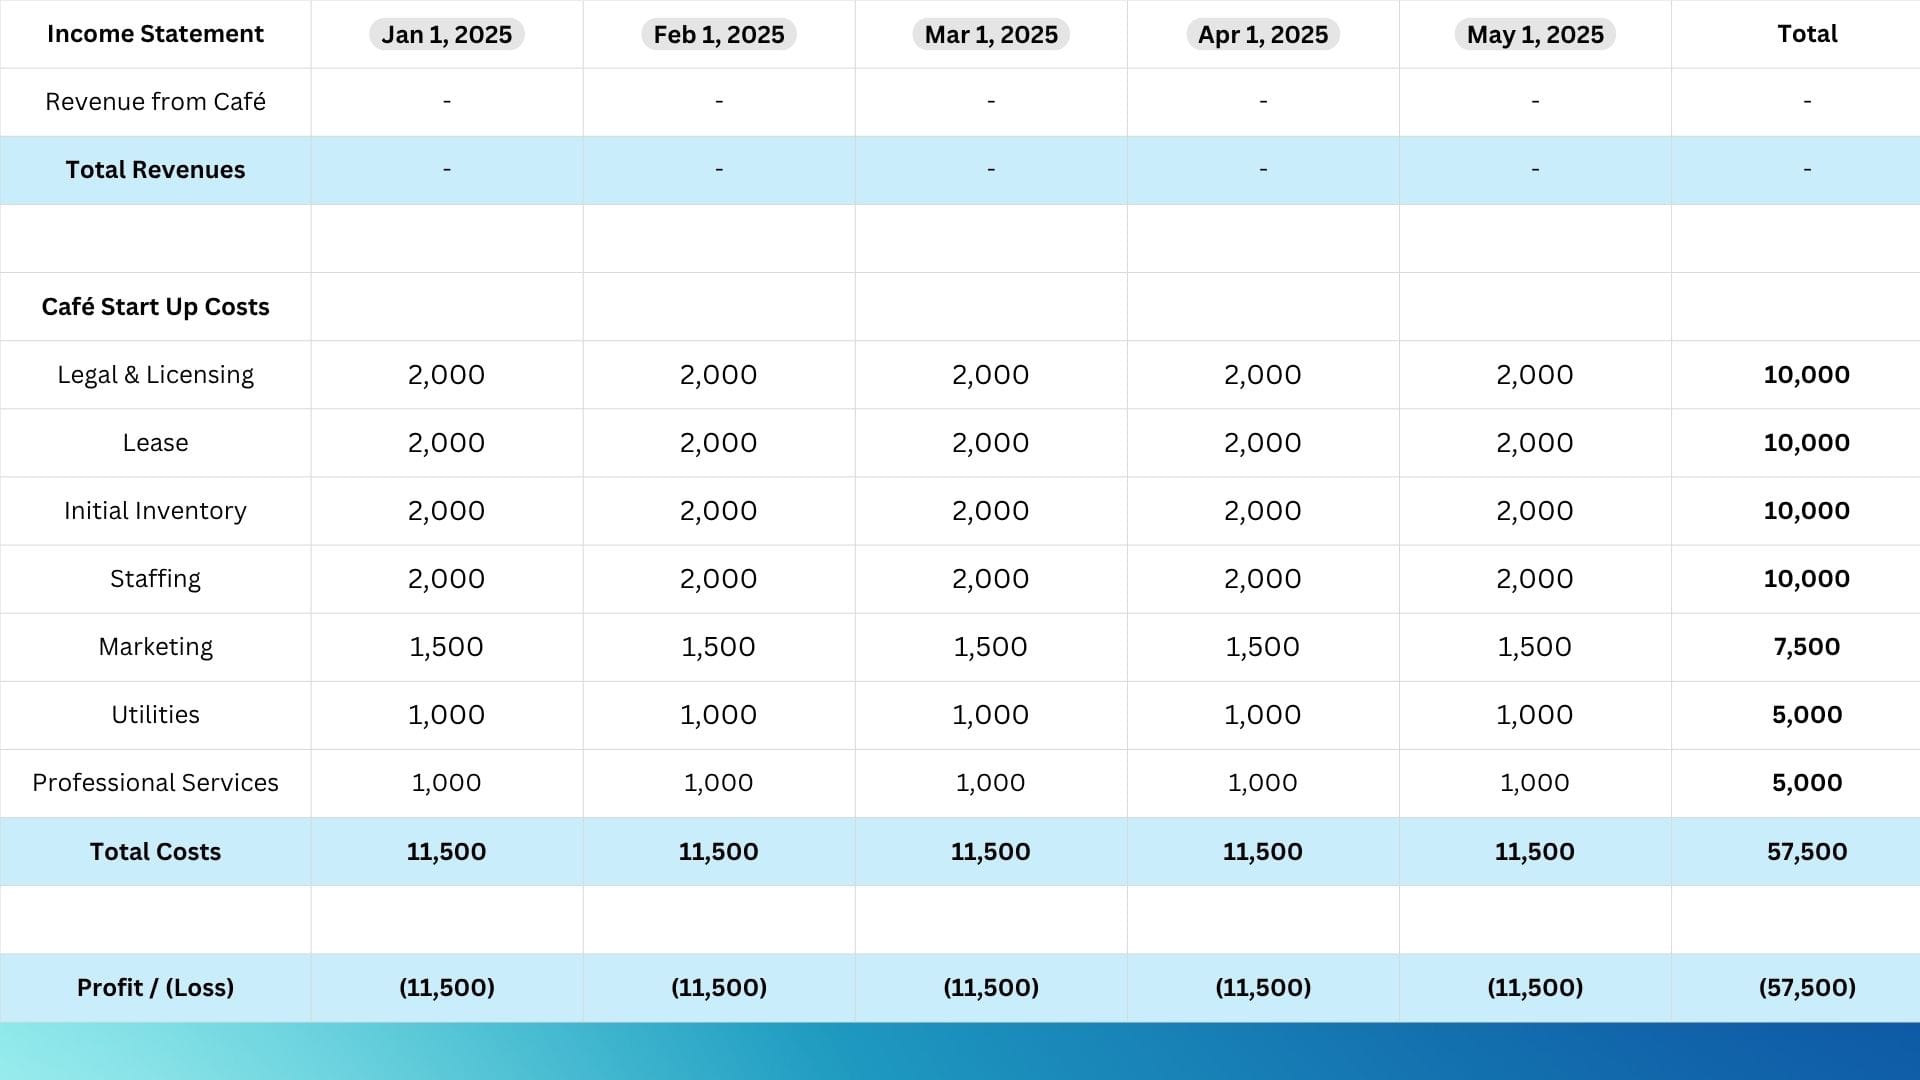
Any start up business would burn cash in it's initial months till it is able to generate revenue which covers the costs of running the operations. What level of revenue or sales will it first cover the costs so that the profit level goes from negative to zero? Let us now deep dive into Breakeven Analysis.
Breakeven Analysis
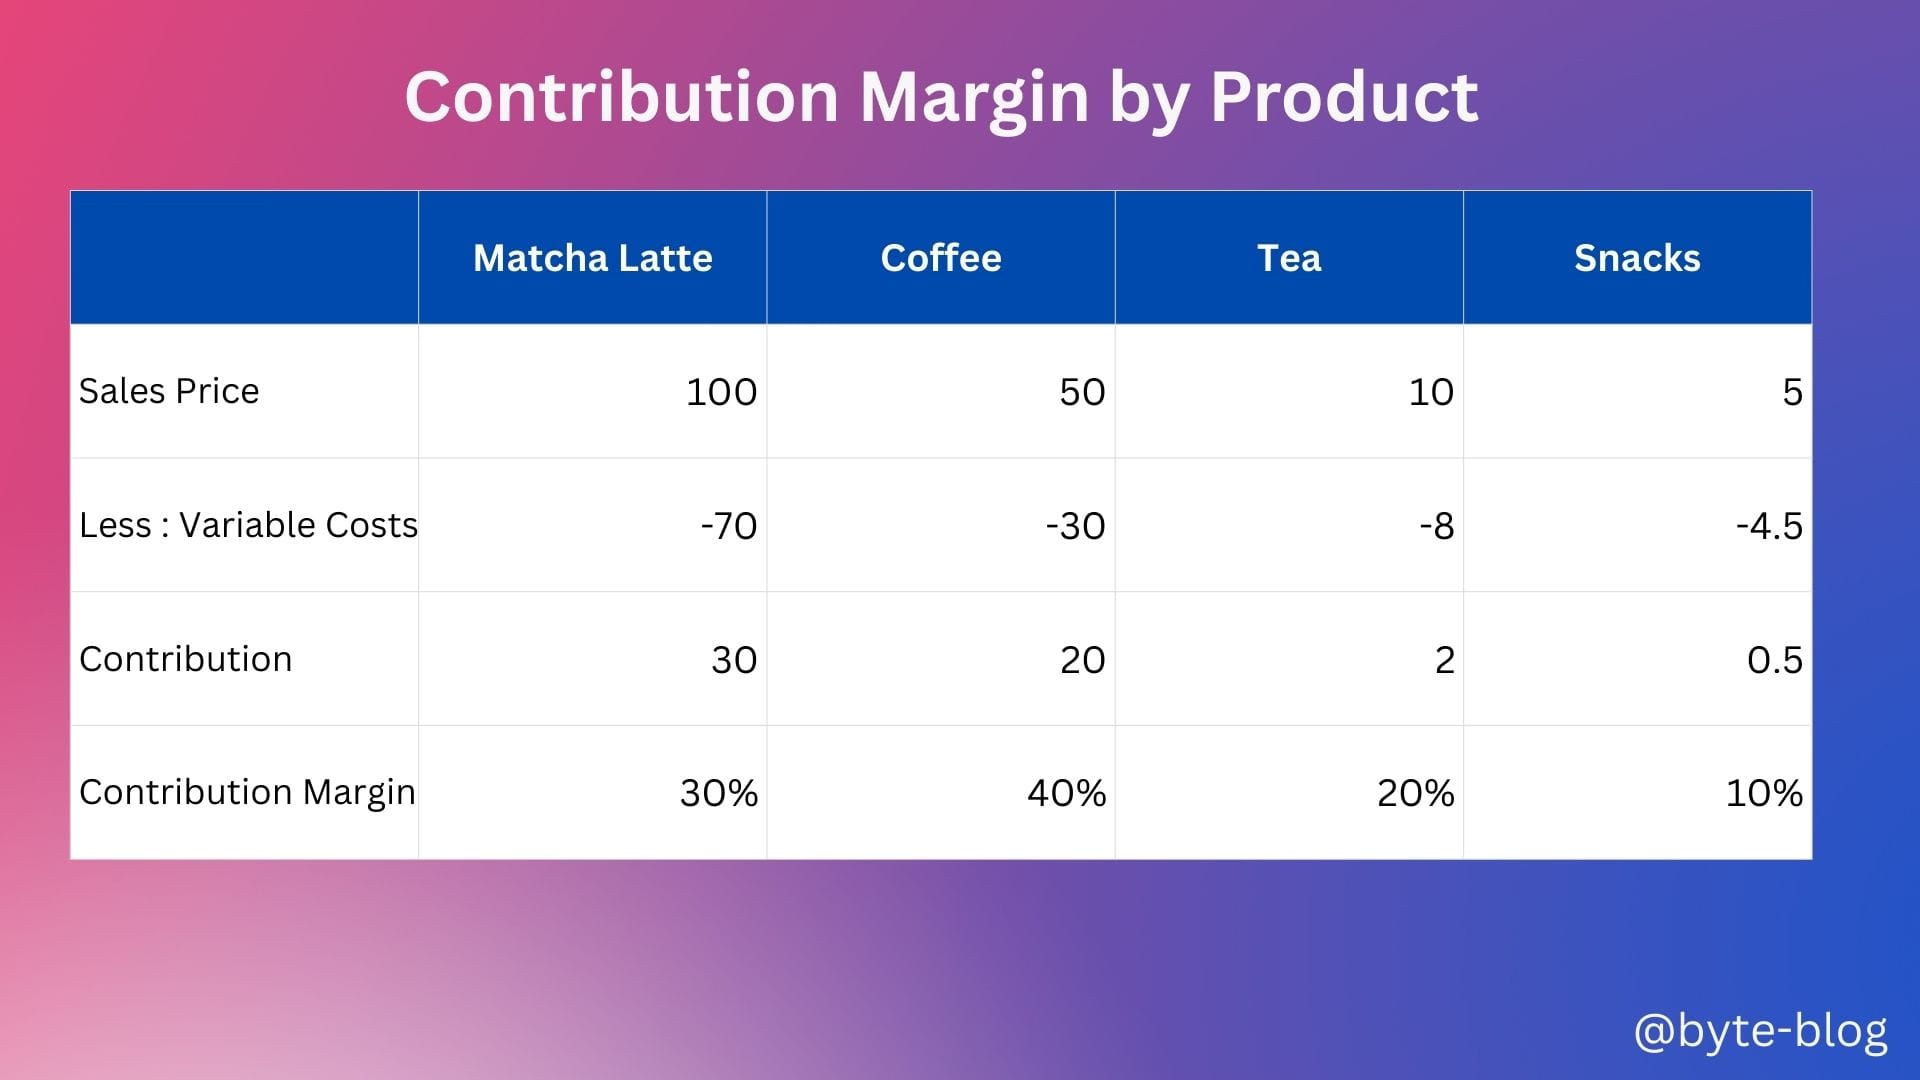
Assume the above operating expenses continue & needs to be covered. Jack has now started selling his products & incurs additional variable costs. Let us now recap something we discussed during Week 10 - Contribution Margin. What is Contribution Margin?
The contribution margin is computed as the selling price per unit minus variable cost per unit. (Source : here)
This measure indicates how much a product contributes to the overall profitability of the company. Once the variable costs are covered, what is remaining to be covered is the fixed costs.
Products with higher contribution margin covers fixed costs faster, meaning it requires less units of sales volume to cover fixed costs while products with lower contribution margin needs higher sales volume to cover fixed costs. Let us recap the below visual from Week 11 :
For our analysis, let us assume Jack only sells Matcha Latte. Let us see his sales volume over five months from June to Oct 2025 assuming his fixed operating expenses continue at the same level.
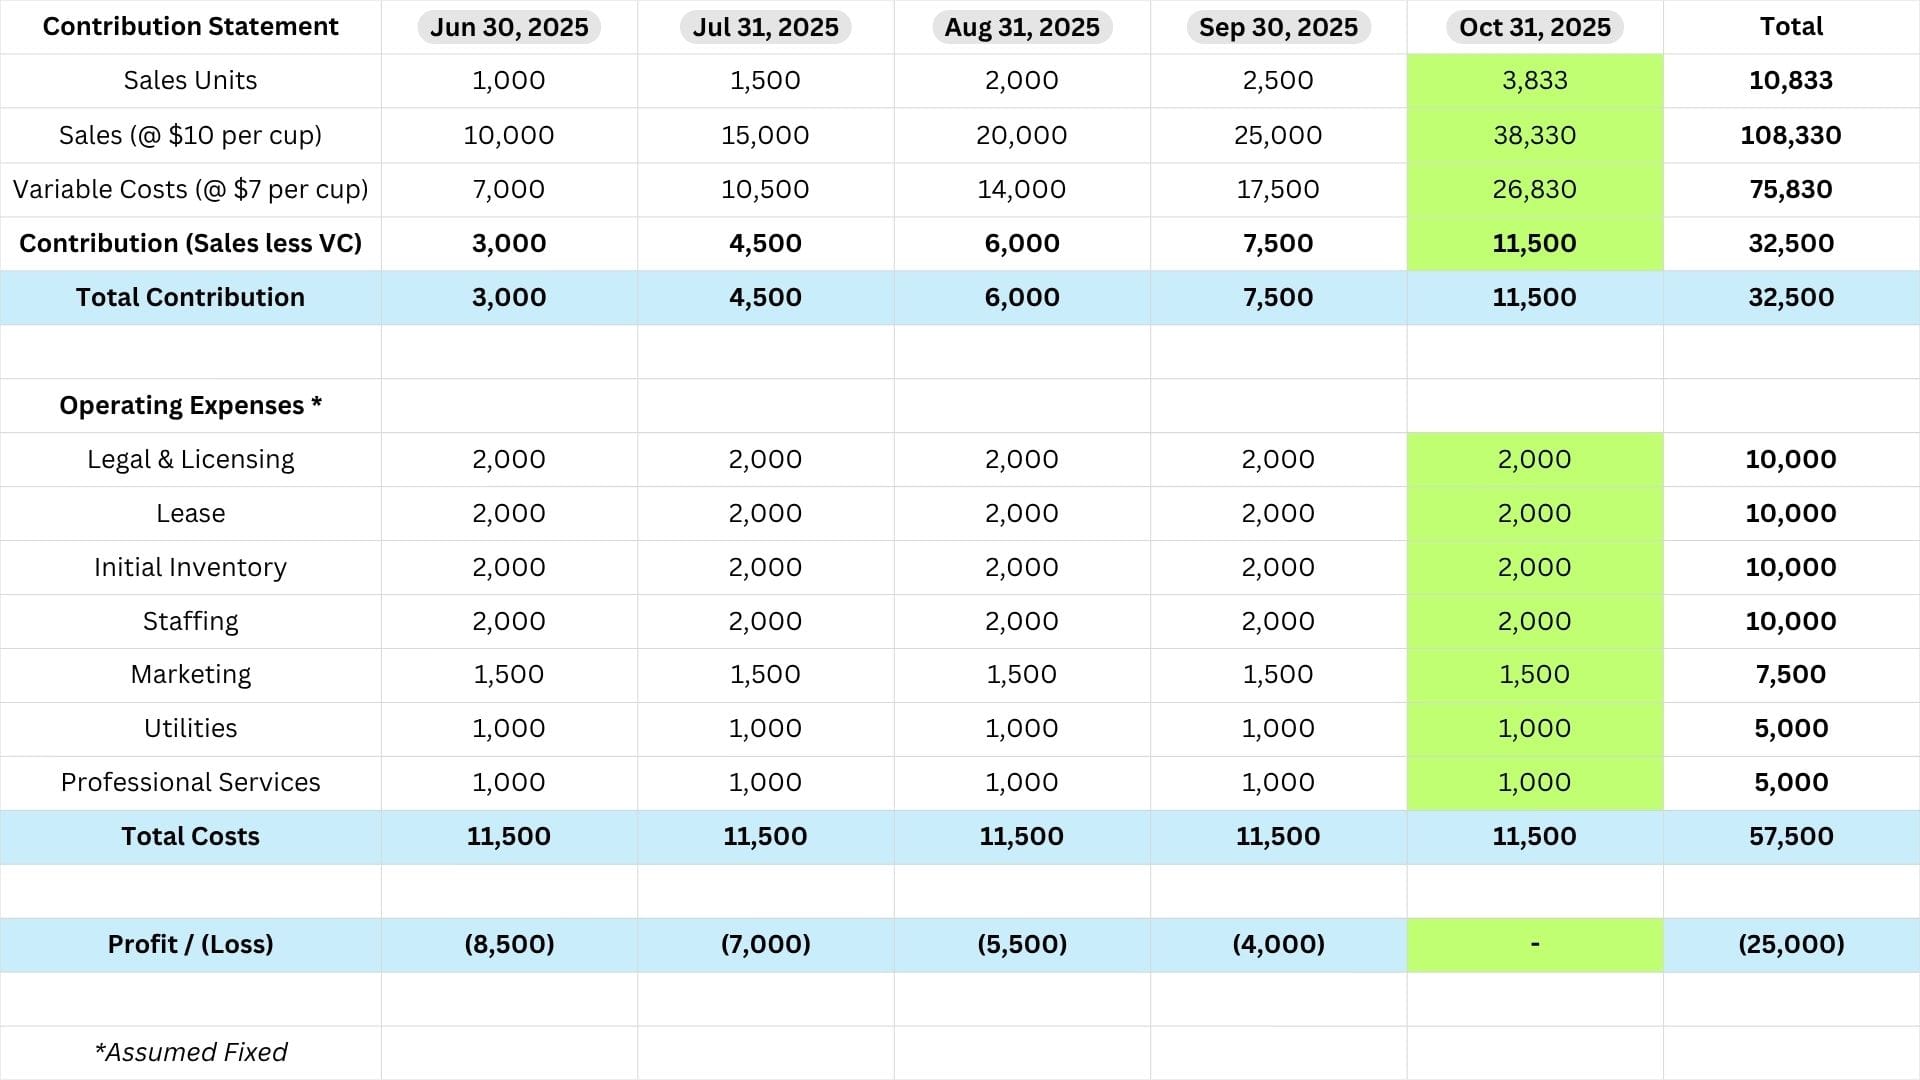
So, as his sales volume increases, his loss keeps reducing till it reaches zero. It means the product revenue exactly covers the total variable costs for producing & selling Matcha Latte & the organizational fixed costs. This point at which product revenue covers the variable & fixed costs is called Break Even Point.
Let us now define it :
Break Even Point refers to the point at which total costs & total revenue are equal. A Break Even Point analysis is used to determine the number of units or dollars of revenue needed to cover total costs. (Source : here)
The formula for calculating Break Even Point (BEP) is
BEP = Fixed Costs / Contribution margin per unit
In our example above,
BEP = 11,500 / (10 - 7) = 11,500 /3 = 3,833
This means the breakeven point for Jack's cafe assuming he sells only Matcha Latte is 3,833. He has to sell 3,833 units of Matcha Latte to cover his total costs or break even with zero profit.
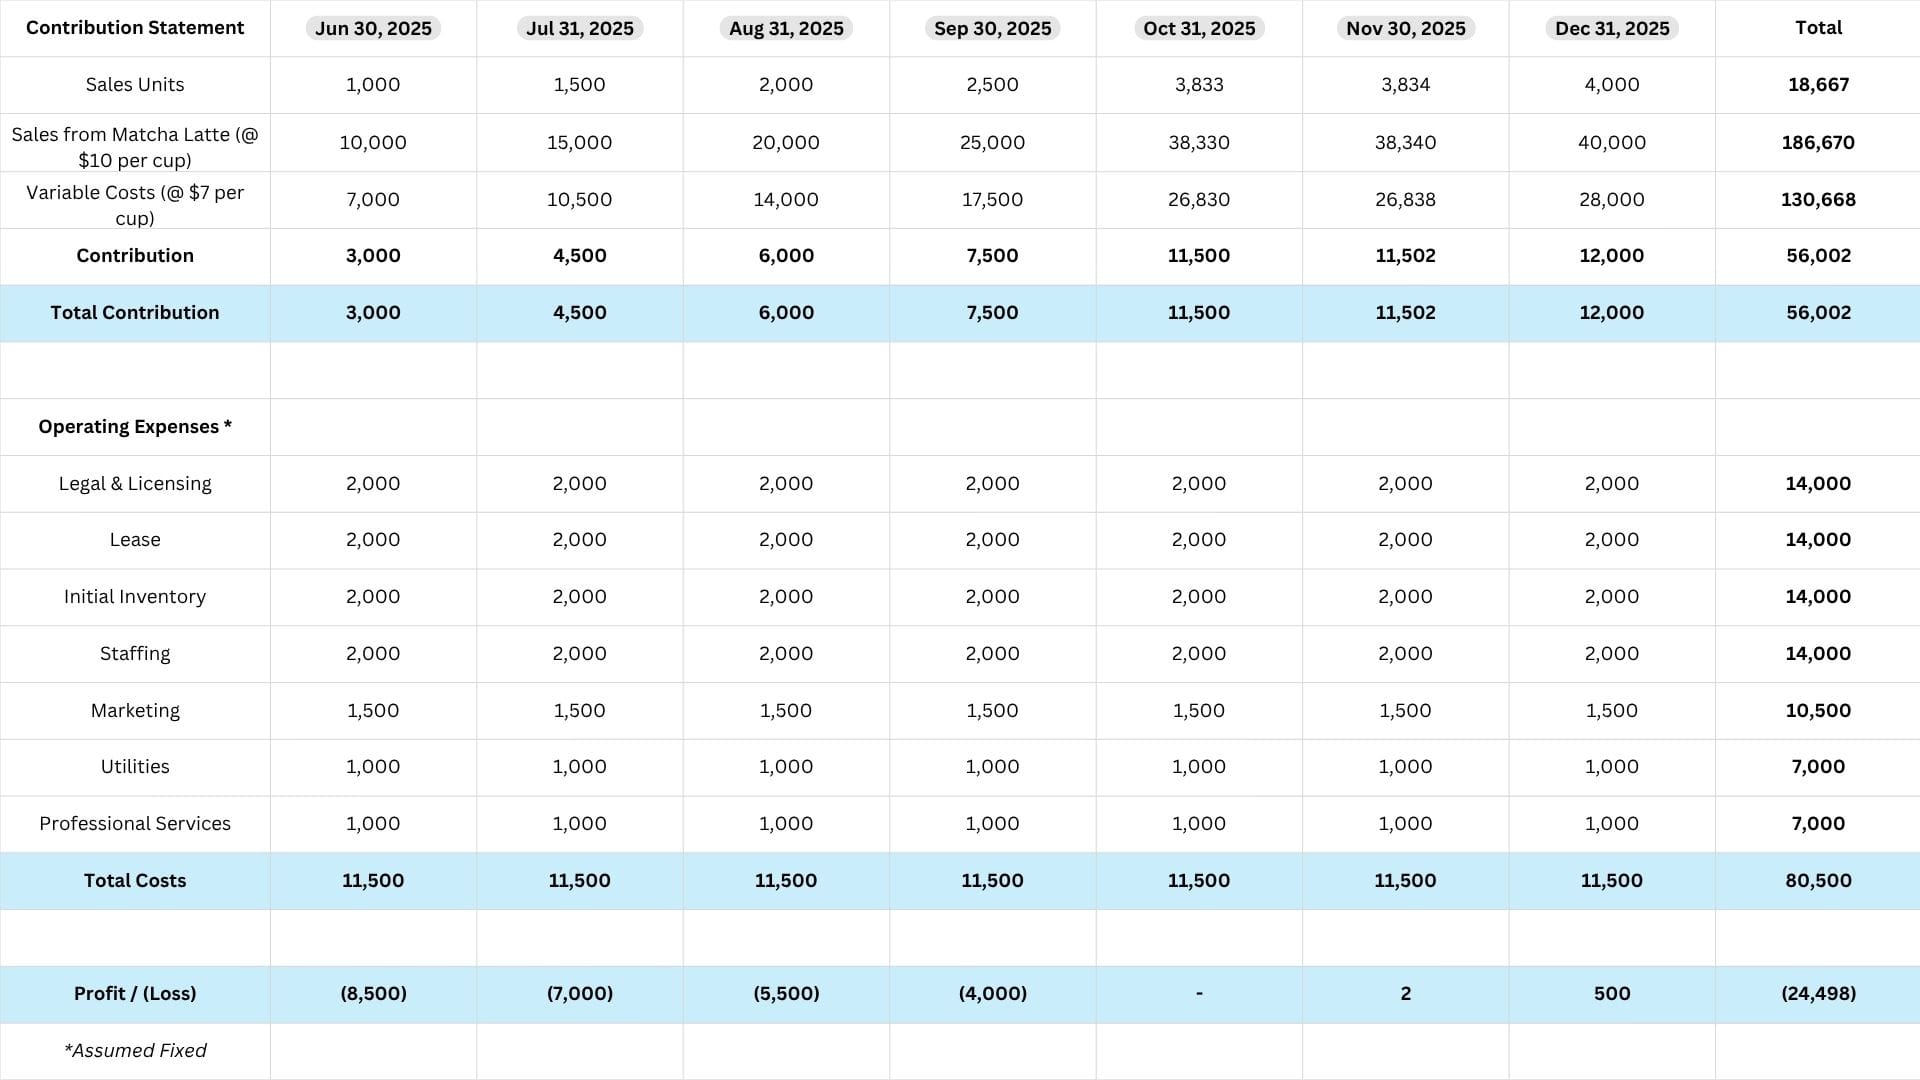
Each unit sold above 3,833 units adds to his profit meaning his profit increases as he sells more units above this breakeven point.
We will play around this topic over the next couple of weeks under a broad heading called "Unit Economics".
We already started our journey to understand unit economics by discussing contribution margin & breakeven point. But let us dive deeper. This topic is really key to understand business drivers of any industry.
