Finance Byte - Week 8 Gross Performance

Table of Contents
- Recap
- Income Statement Deep Dive
- Level 1 - Gross Profit
Recap
Transactions
During Week 7 of Finance Byte, we started with the meaning of reporting numbers from First Principles which means everything starts from transactions, Reporting numbers arise from transactions & the net impact of transactions should be positive for Jack, our cafe owner.
But for transaction numbers to make sense, they have to be classified using some logic. We started with the below transaction listing.
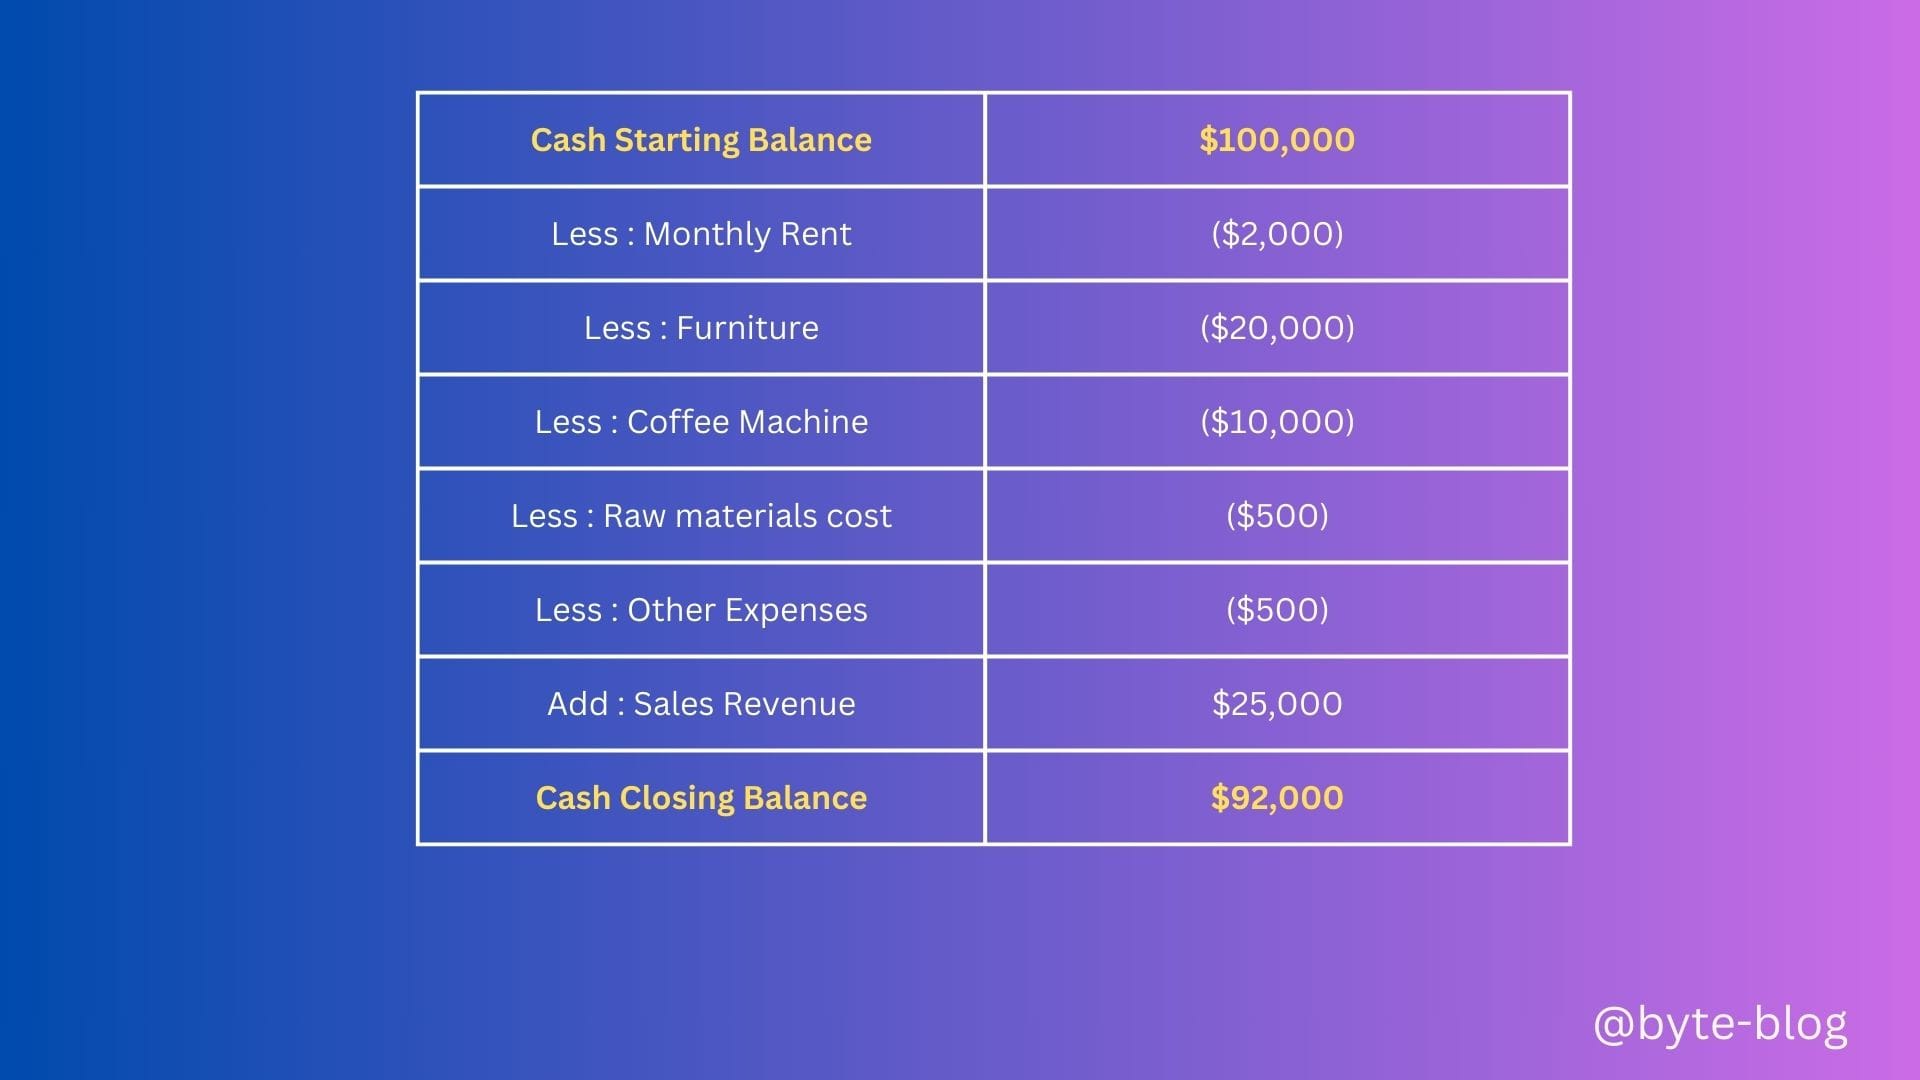
All these transactions result in changes in cash balance depending on whether they are outflows (expenses & purchases of assets) or inflows (revenue). We assumed all transactions are done in cash to make our discussion easier.
Transaction Classification
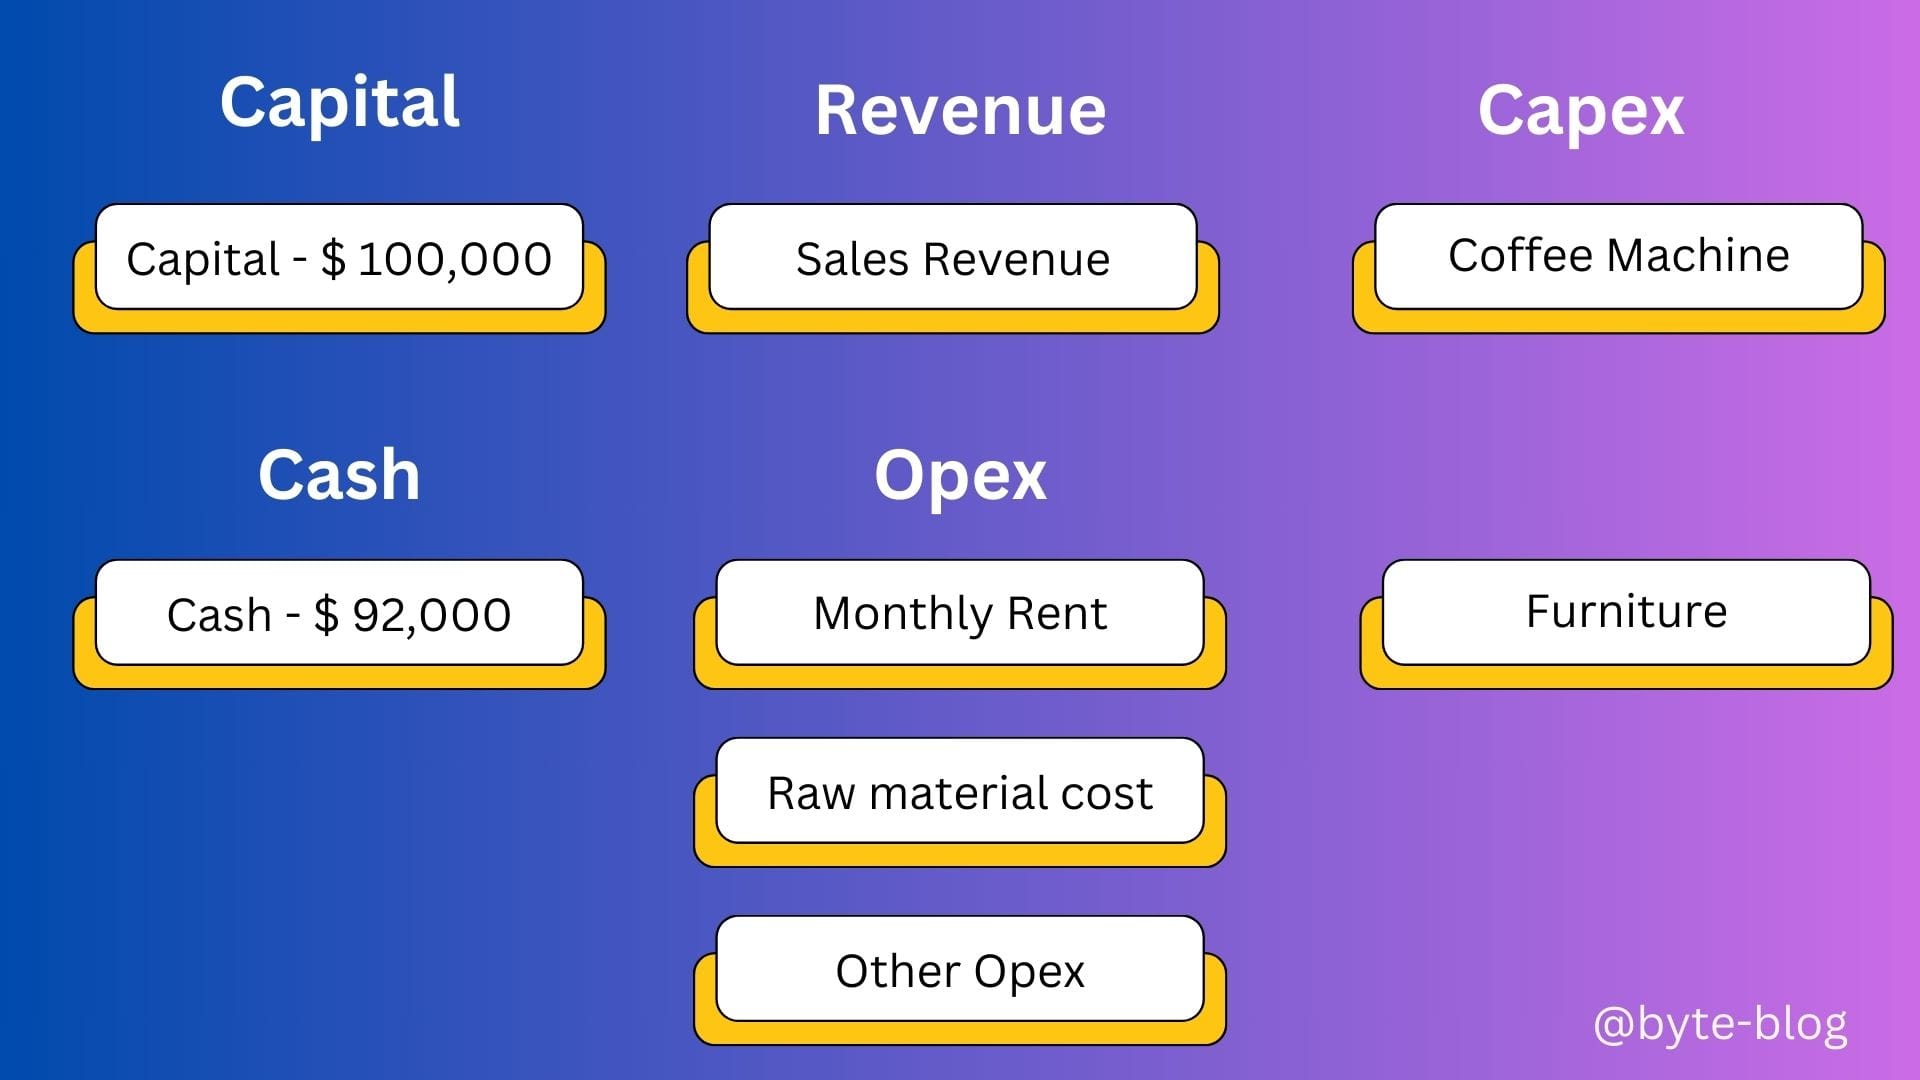
Then we set out to classify the above transactions under certain heads for Jack to make sense of all these numbers & how can he tie up all these to make sure he is actually making more money from his business than what he is spending on it - meaning is he making a profit or not?
We classified transactions based on :
- Their nature &
- Their objective
And visualized it as below:
If the revenue earned from business is greater than his operating expenses or opex (costs of doing business), his business will generate profits otherwise it is loss - making.
We combine all these income & opex transactions into a financial reporting statement known as "Income Statement" which we defined as :
An income statement is a financial report detailing a company’s income and expenses over a reporting period. It can also be referred to as a profit and loss (P&L) statement and is typically prepared quarterly or annually.
Normally, income statement is prepared for a particular period - can be a month, quarter, half year or year. It's like how much revenue is earned over expenses for that period.
So Jack will know over a period of say 3 months, 6 months or 1 year, did his business make a profit or a loss.
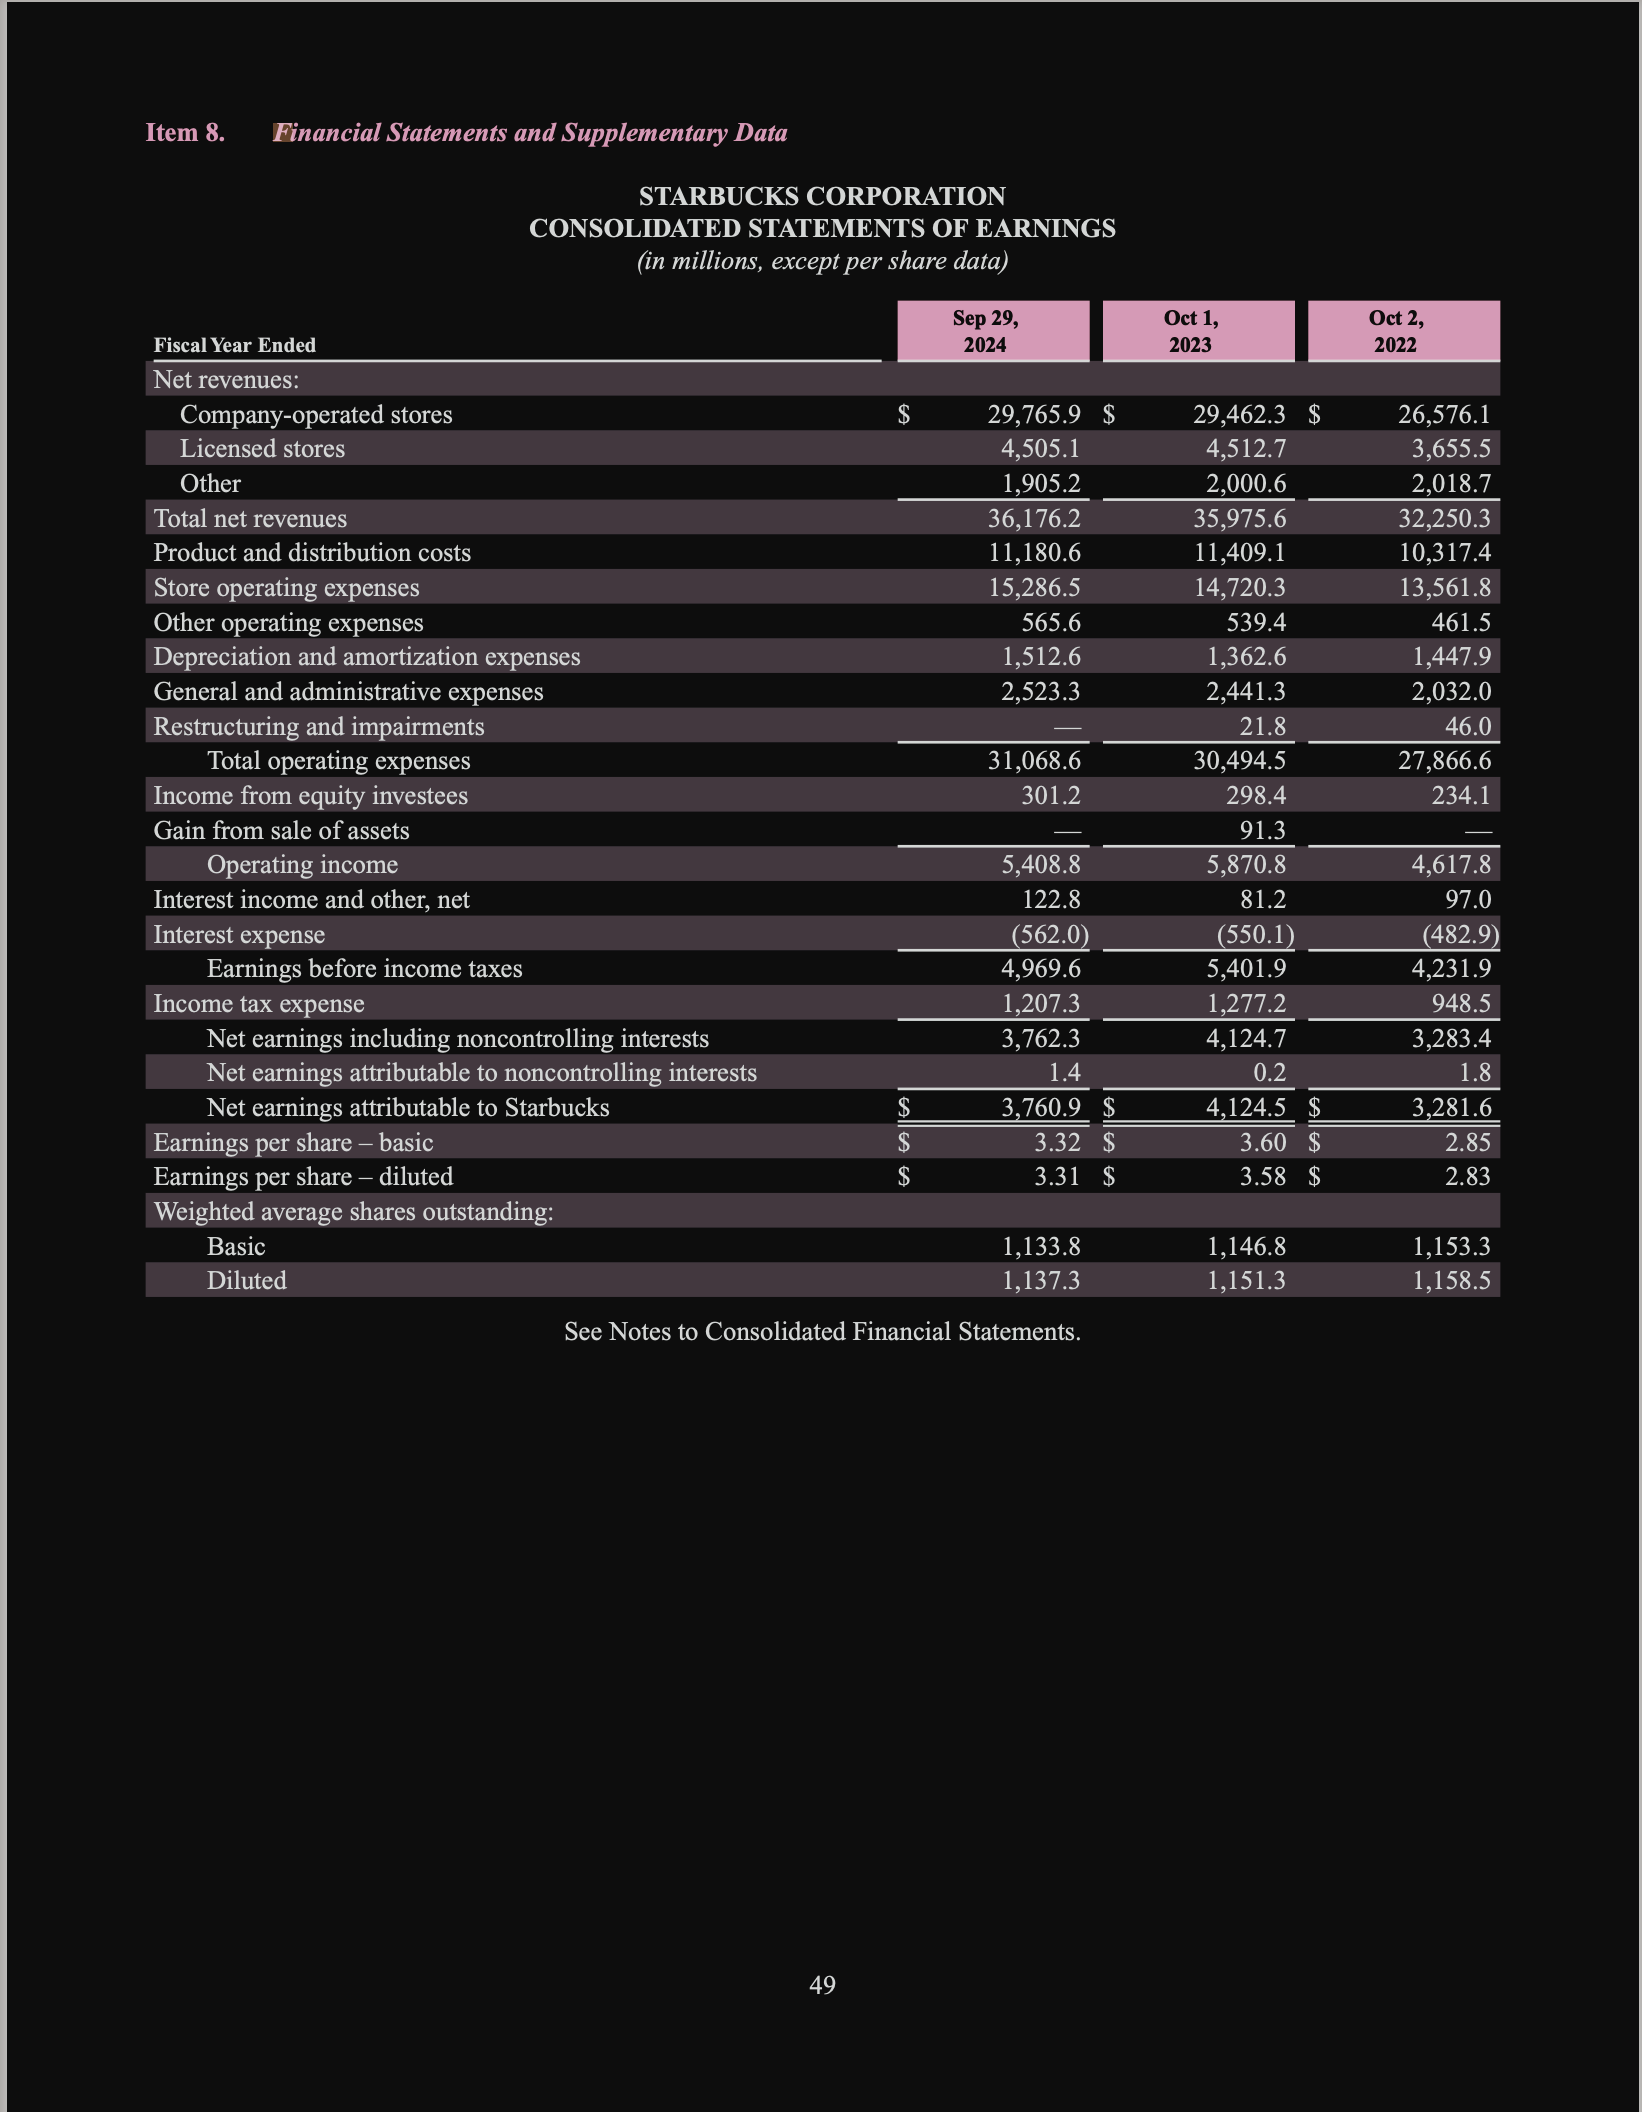
We ended with the Income Statement of Starbucks for the year ended 30th September 2024.
Let's do a deep dive on Income Statement from top line to bottom line.
Income Statement Deep Dive
Before we deep dive into income statement, let us revisit the below visual from Week 5.
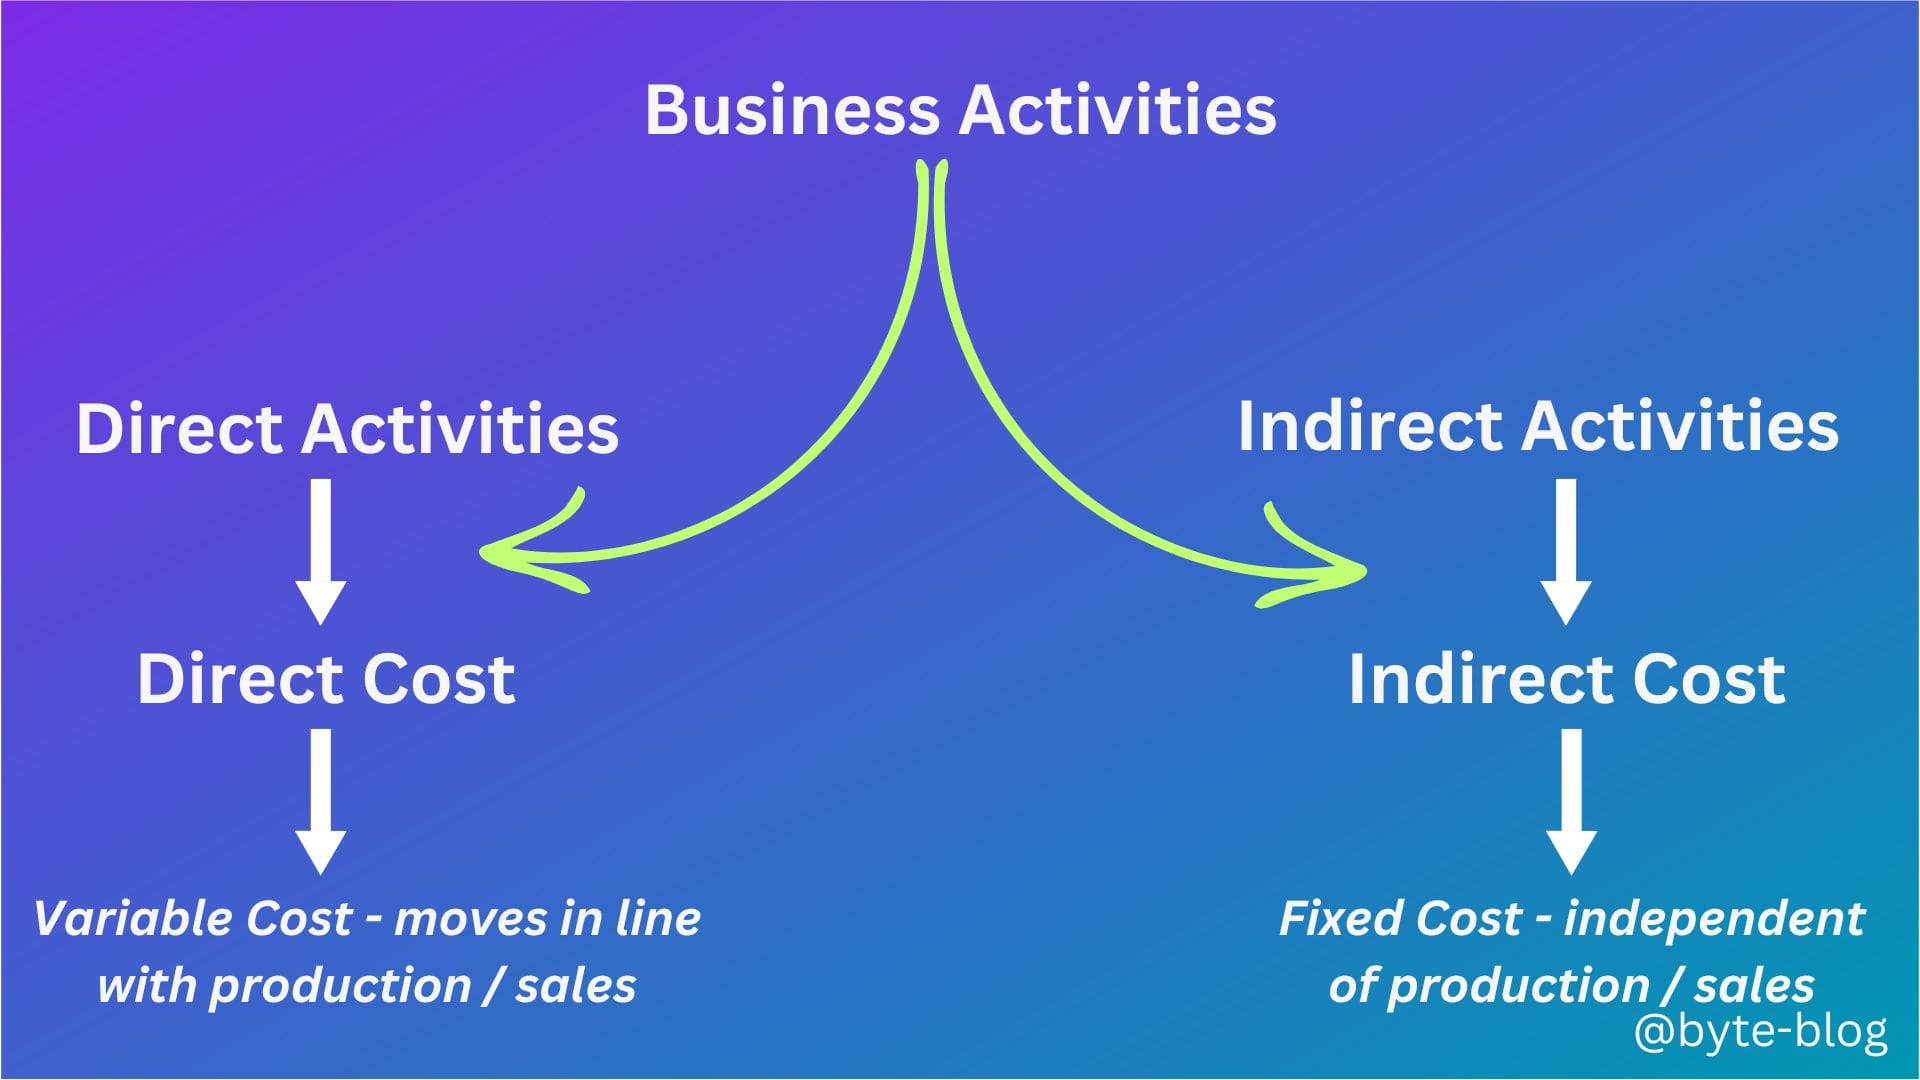
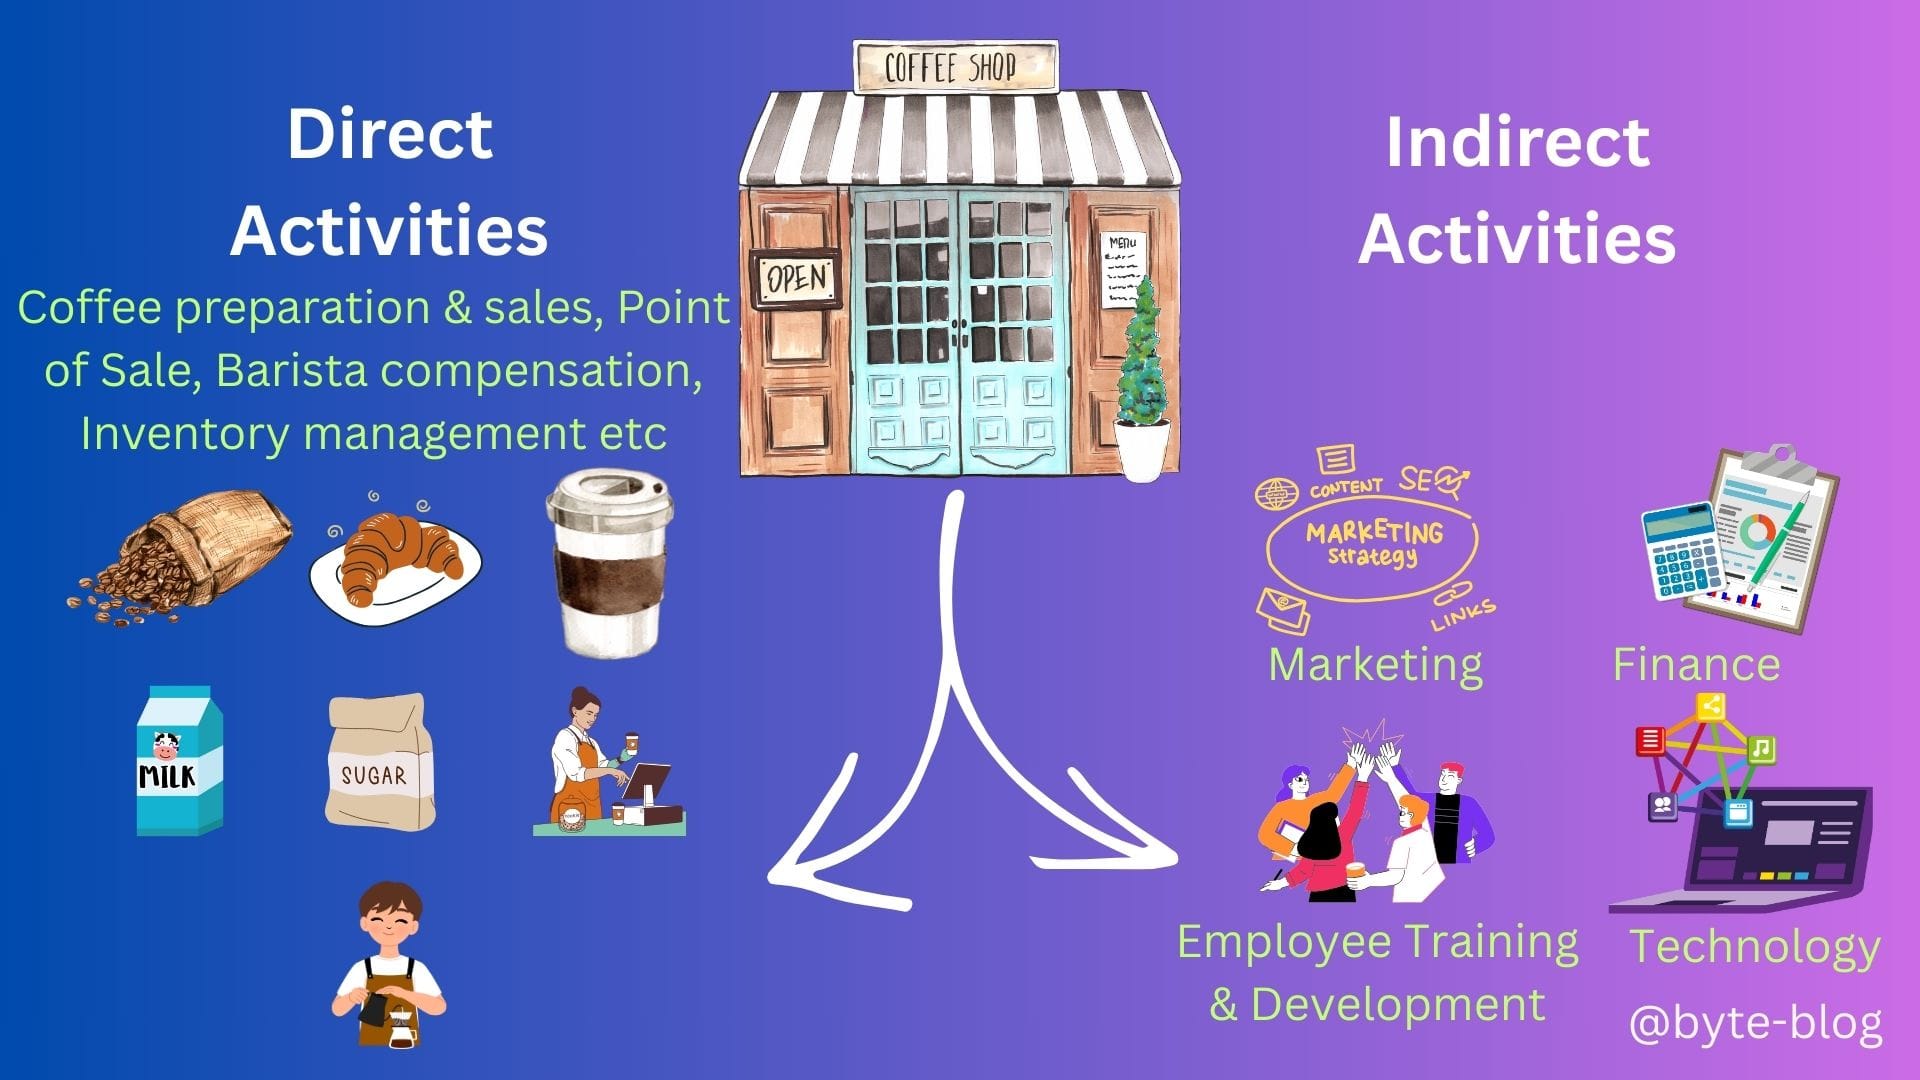
There are two activities in any enterprise :
- Activities directly related to producing & selling the goods / services or in other words, Direct Activities
- Activities not directly related to producing & selling the goods / services or in other words, Indirect Activities
So, income (revenue) or expenses (spends) can relate to any of the above. What are the direct & indirect activities for a coffee shop? Let's visualize them as below :
So, the costs related to these activities will also be classified as :
- Direct Costs &
- Indirect Costs
Why is this important? Because without direct activities, a business may not survive for even a day. For e.g., assume all the baristas resign or there is a crisis by which the business cannot procure milk or coffee seeds. Without these, the cafe would not be able to make coffee. These issues can cause sales to come to a halt until resolved.
We will analyze performance at two levels :
- At the Direct Level - Level 1
- At the Indirect Level - Level 2
It is not only costs which are impacted by this classification. Revenue also can be classified based on activities at the direct & indirect level.
What does the above mean? Let's dive in :
Level 1 - Gross Profit
Direct Level means activities resulting in revenue & costs related to the core business activities required to run the business as visualized above. In simple terms, it means the revenue earned from core business activities & the cost incurred to generate that revenue.
This is what is normally shown first in an income statement and the line items depends on the industry. A simple statement template would look like (Source : here) :
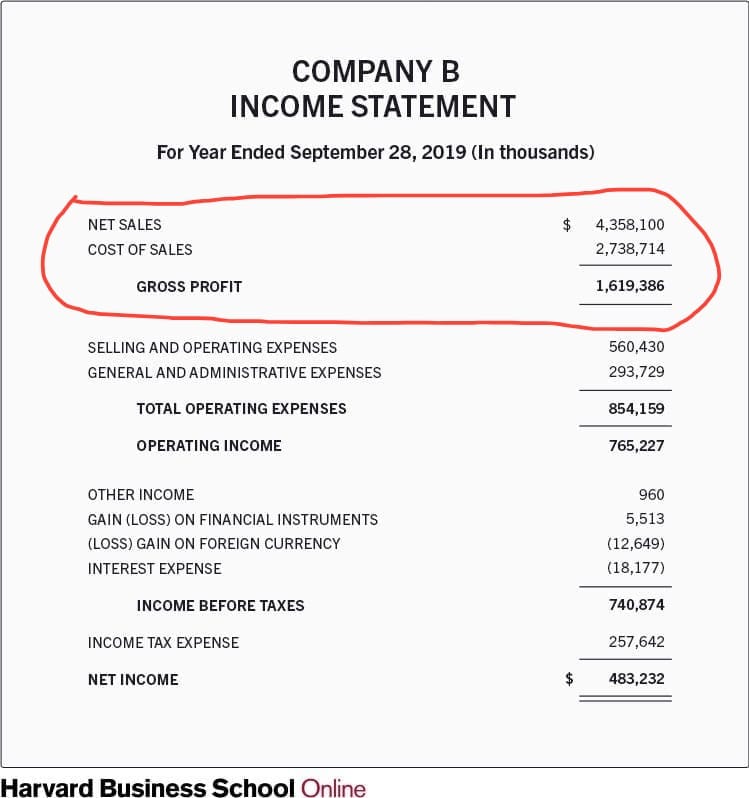
The result of direct activities is what is marked inside the annotated space:
"Net Sales - Cost of Sales = Gross Profit"
At the first level, if the income derived from direct activities is greater than the cost of these activities, then the resultant positive number is called "Gross Profit".
This number shows how efficiently a company manages it's production or direct activities. Efficient management of production / direct activities means managing pricing, volume, direct costs (raw material, inventory, shipping etc) in a way that results in positive gross profit.
Higher Gross profit levels conveys optimal pricing combined with optimized processes for material / labor sourcing & conversion costs. (conversion costs means costs to convert raw material to final product)
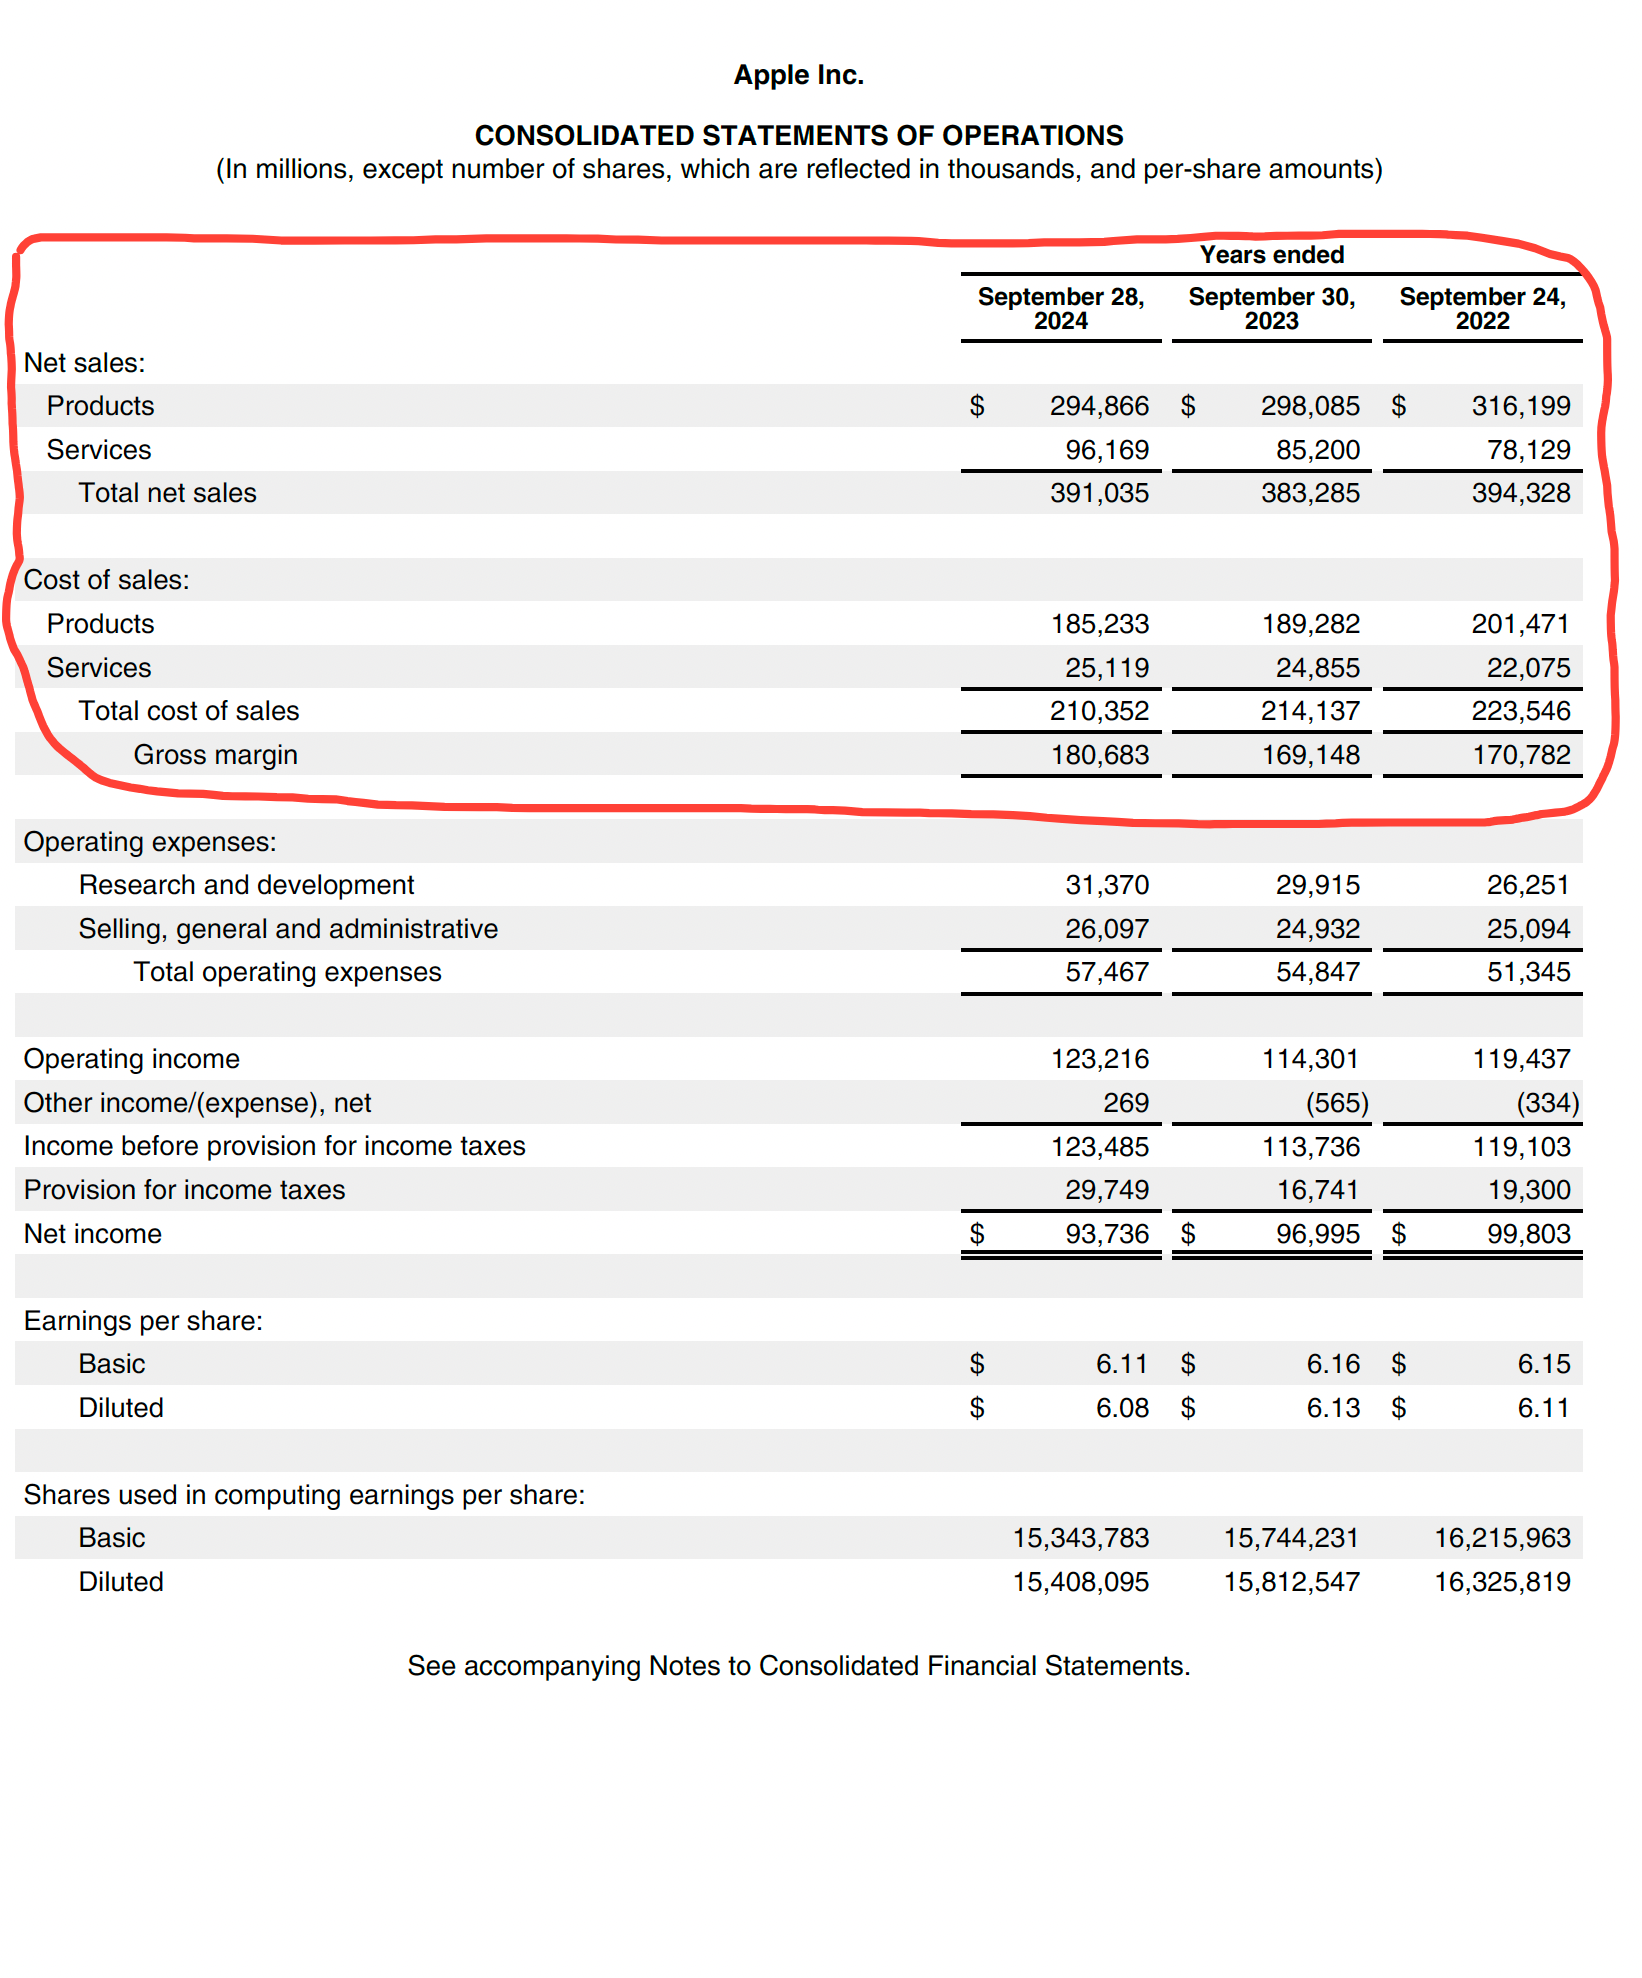
Let us look at the income statement (or Consolidated Statement of Operations) of Apple Inc (Source : Annual report). If you see the selected portion below, it represents the gross profit (or gross margin as stated) for Apple which is the difference between
- Net sales of products & services (which means sales less returns of items sold) less
- Cost of selling those products & services.
E.g., sales of Iphones / Mac / Ipad / other services like app store etc less cost of making & maintaining these products & services.
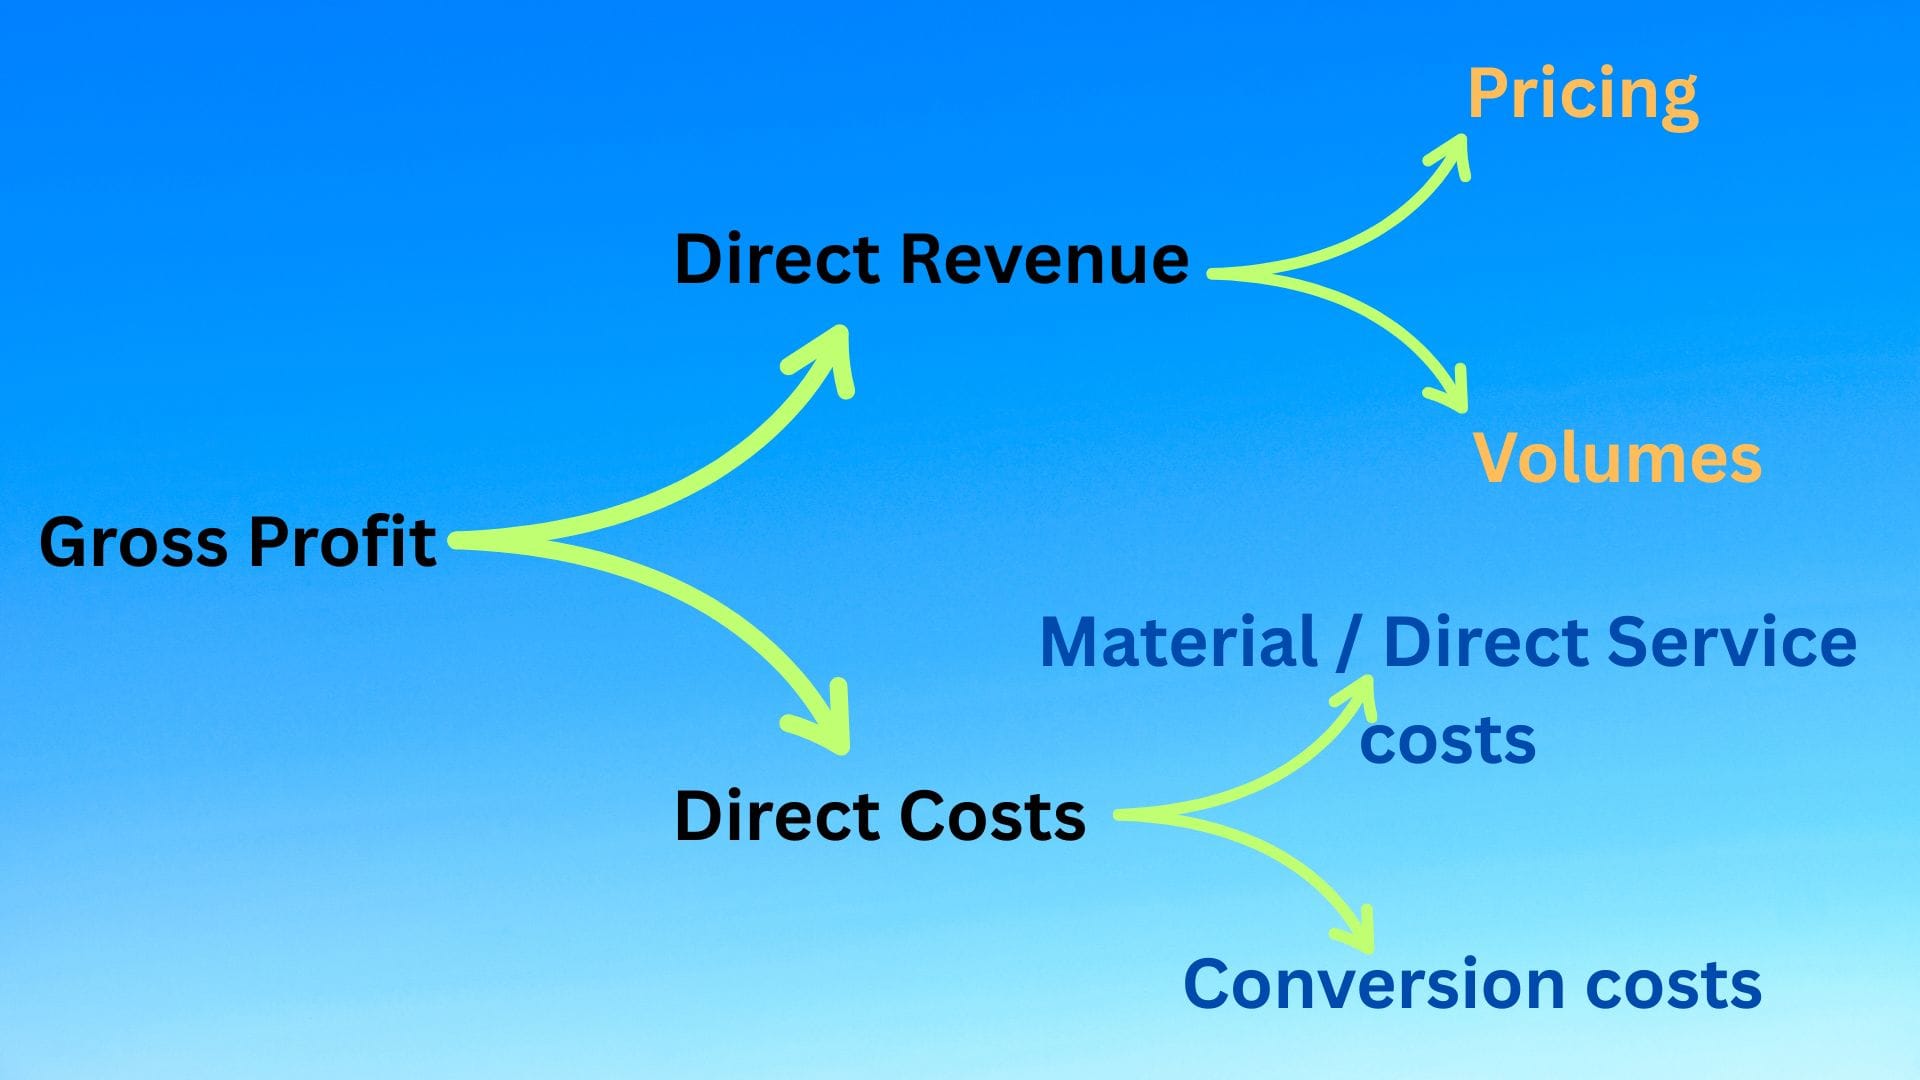
Another way to look at gross performance is that Gross Profit is impacted by :
A. From Revenue Side
- Price of goods / services sold
- Volume of goods / services sold
B. From Cost Side
- Cost of materials / other services procured
- Labor / other costs to convert the raw materials / deliver services in it's final form
Visualizing the above :
Now, a question - Why is this type of analysis important?
A company like apple has multiple products (Iphone, Ipad, Macbook etc). They need to know which product earns more at the direct level & by how much or what is the contribution level of those products to the company. But how?
We will continue with our discussion with another concept called "Contribution Analysis".