Strategy Byte - Week 39 More Supply

Table of Contents
- Recap
- Supply Curve / Supply Schedule
- Change in Supply
- Elasticity / Inelasticity of Supply
Recap
During Week 38, we started exploring supply by defining it as
the number of units of goods or services a supplier is willing & able to bring to the market for a specific price.
Just being willing & able to supply goods or services to the market is not enough - there has to be demand for those goods or services at that specific price point. Thus, price is a key link between supply & demand of a good or service
We then described quantity & price at which supply is done.
Like the Law of Demand, we defined Law of Supply as
Other things remaining constant, an increase in the price of a good or service leads to an increase in the quantity supplied, while a decrease in price results in a decrease in the quantity supplied.
We then explored the factors determining supply of goods & services as :
- Cost of Production
- Prices of related goods
- Expected future prices
- No. of suppliers &
- Technology & Innovation
Now, we explore the relationship between price & supply just like we did with Demand. This relationship is represented by a Supply Curve or a Supply Schedule.
Supply Curve / Supply Schedule
At it's core, the supply schedule is a tabular representation of the relationship between the price of a good or service & the quantity producers are willing & able to supply to the market, all things remaining equal. (Source : here)
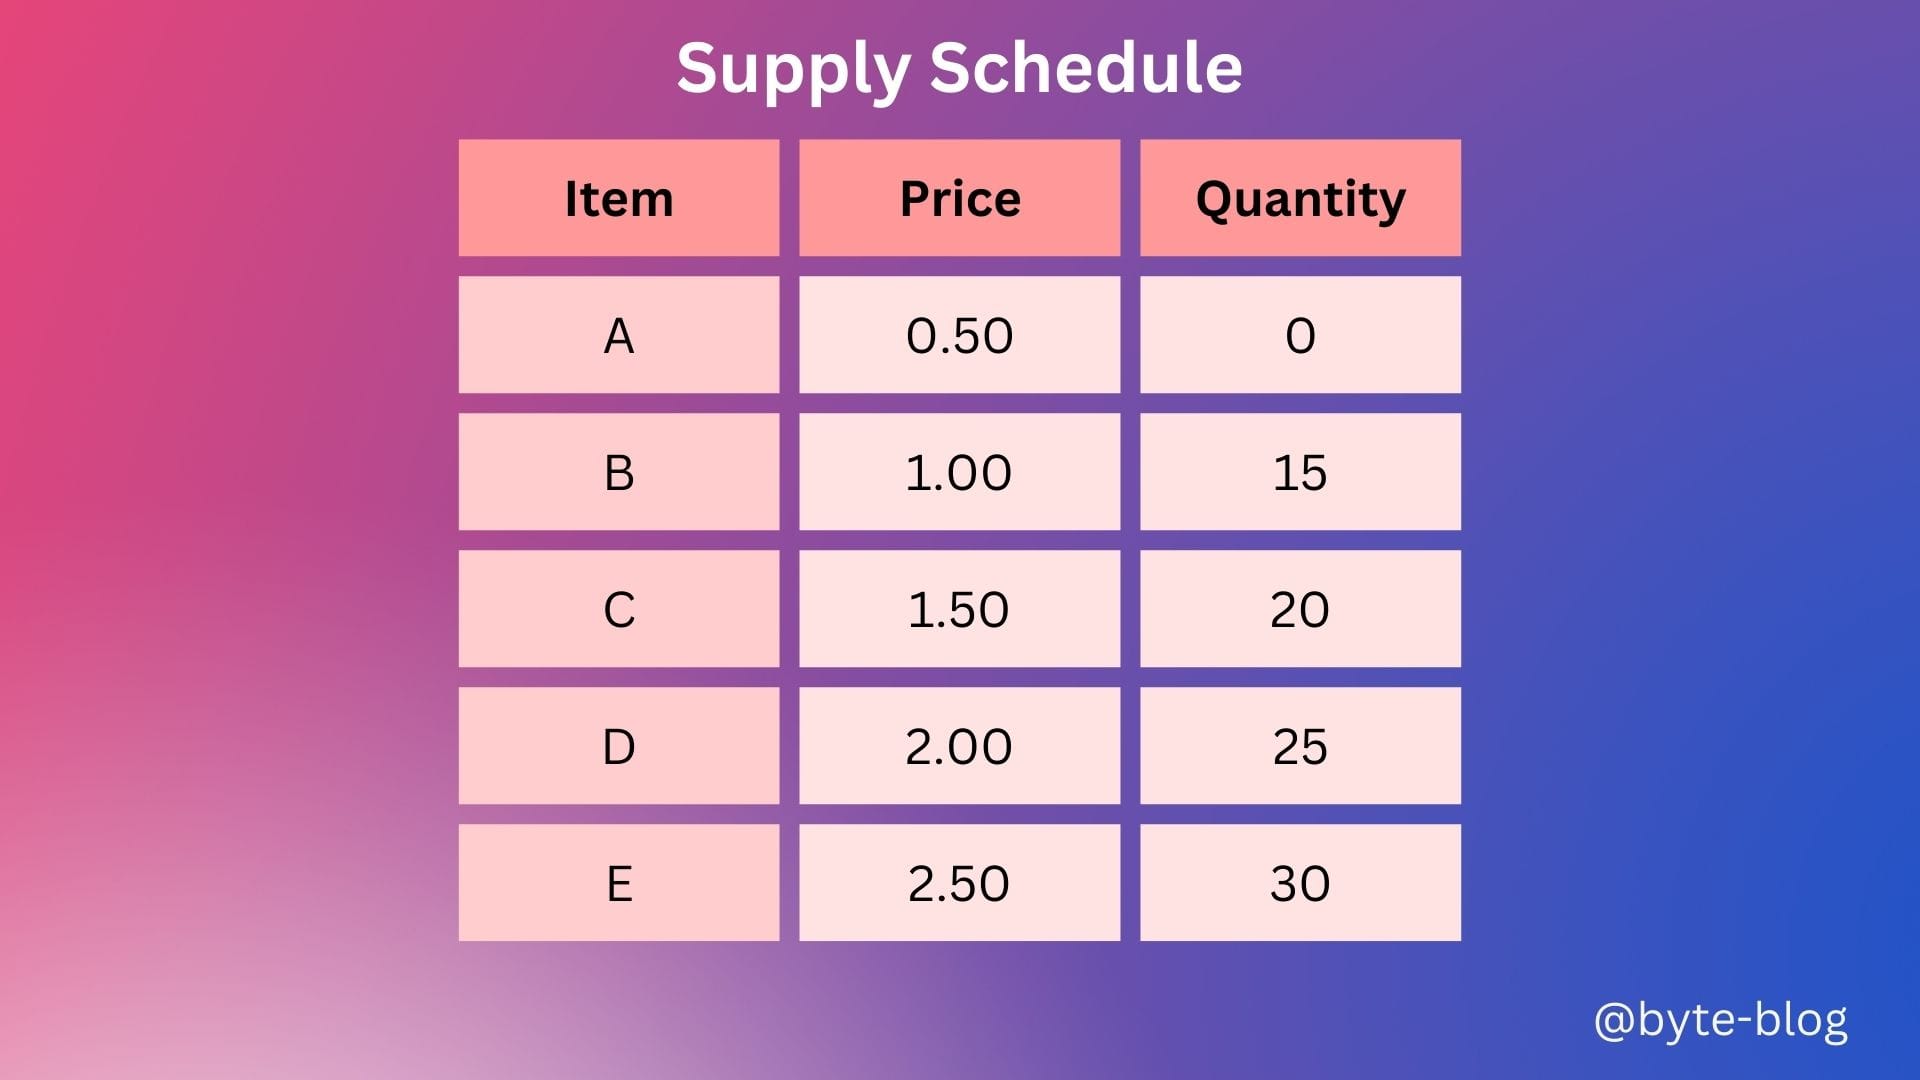
A supply schedule lists the quantities supplied at each price when all the other influences on producers' supply remains the same. For e.g., if the price of an item is 0.50, the quantity supplied is 15 & so on.
The supply curve is a graph of a supply schedule which shows the quantity supplied on the x-axis & the price on the y-axis. (on the demand curve, the price is on the x-axis & the quantity on the y-axis).
Let us make a supply curve for the above supply schedule
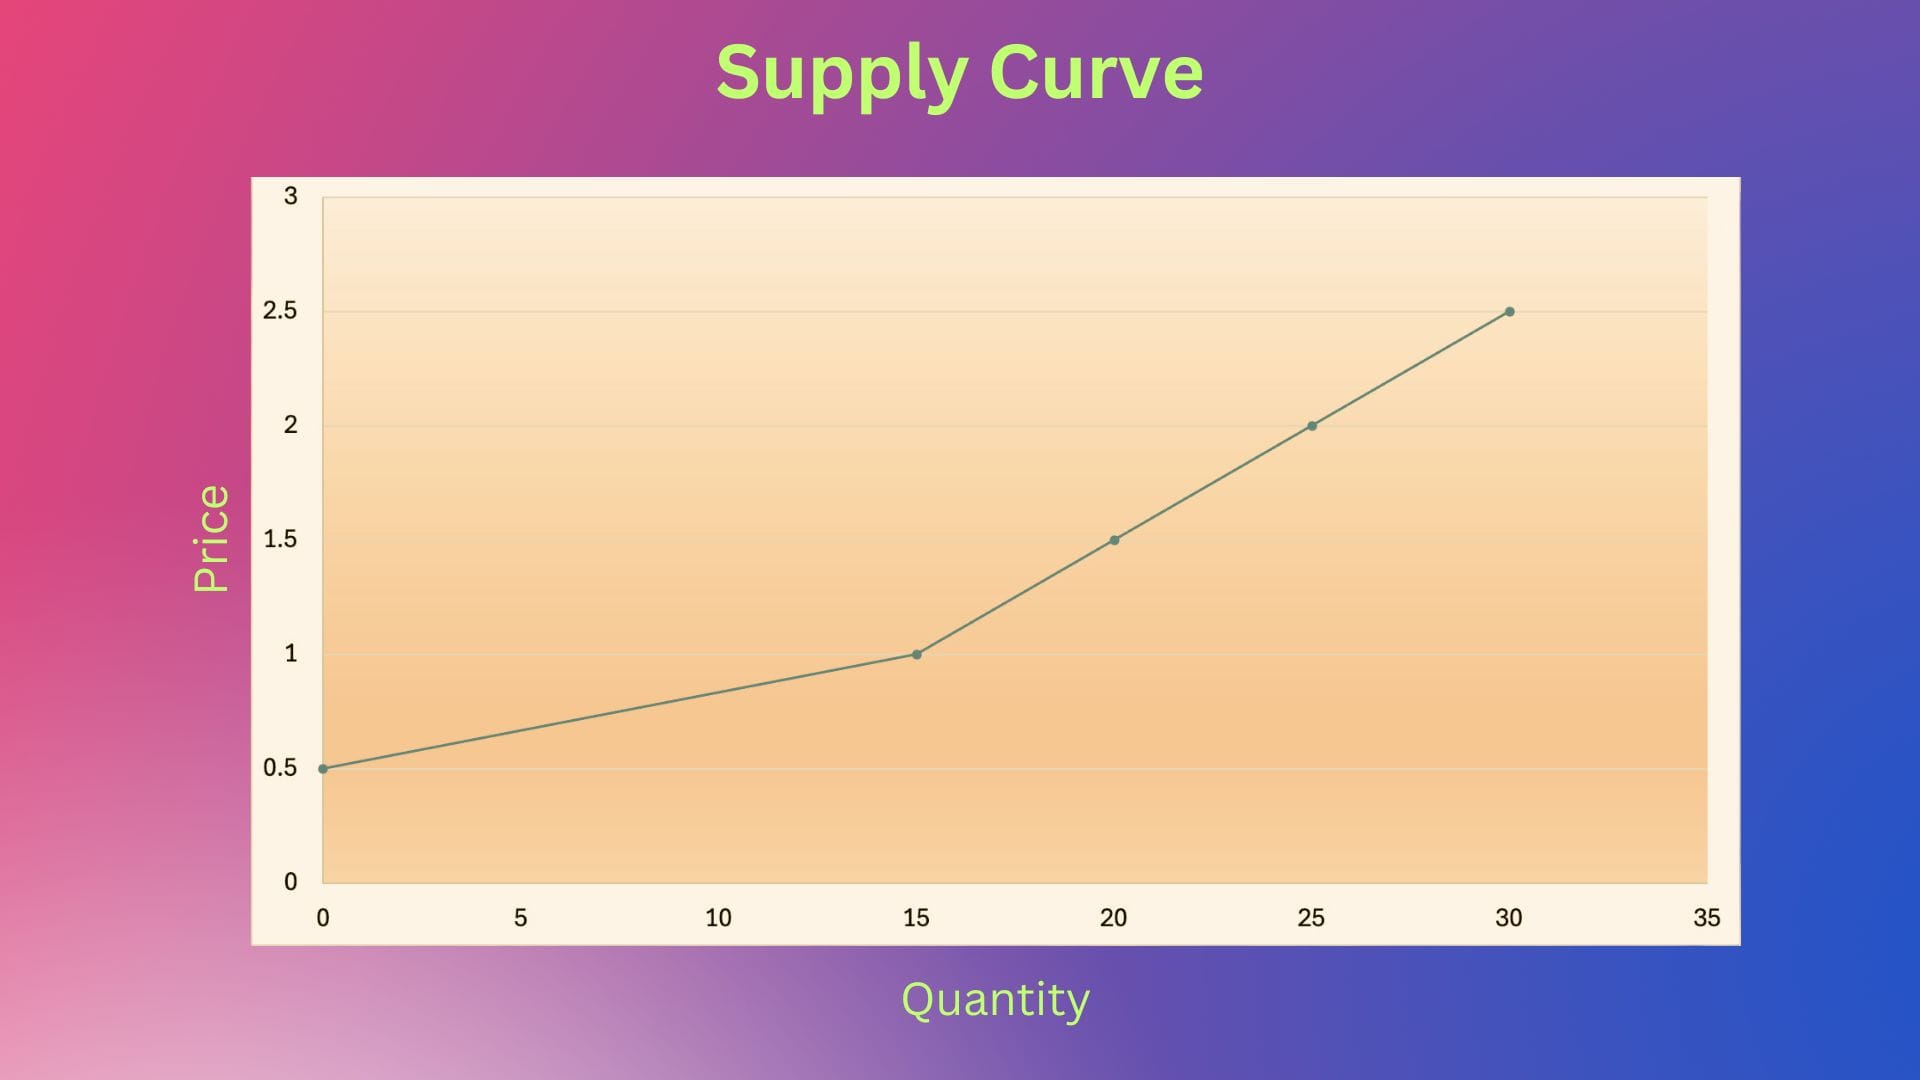
From the above graph, we can see the supply pattern at each price point.
The supply curve typically slopes upwards from left to right, indicating that as the price of a good increases, producers are willing to supply more of it.
Just like Law of Demand, the Law of Supply also starts with a caveat "Other things remaining constant". We made a hypothesis regarding supply considering only change in price & assuming other factors remain constant. Now, let us remove that caveat & bring in the other variables. What are these other variables? We explored them last week & let us do a quick recap.
Change in Supply
When any factor that influences selling plans other than price changes, there is a change in supply. As we discussed last week, five factors which influence changes in supply are :
- Cost of Production - When the cost of production of a good or service rises, a firm decreases their production or supply to reduce losses.
- Price of related goods - The prices of related products can impact the price of main product either positively or negatively depending on it's relationship to the main product. We saw the example of tyre prices & it's impact on bicycle prices. If the tyre prices increase, the price of bicycles also increase.
- Expected future prices - Firms plan their production or supply depending on the expected future prices at which they will be sold. If future prices are expected to be high, firms will delay production to ensure goods are produced & sold at higher prices
- No. of suppliers - More suppliers of a particular good or service results in higher supply of that good or service & vice versa.
- Technology & Innovation - Technology & innovation advances can lead to efficiency &/or improved production processes which impacts supply.
The above scenarios will result in the supply curve moving right or left depending on whether the above factors cause an increase or decrease in supply respectively.
Visualizing the above :
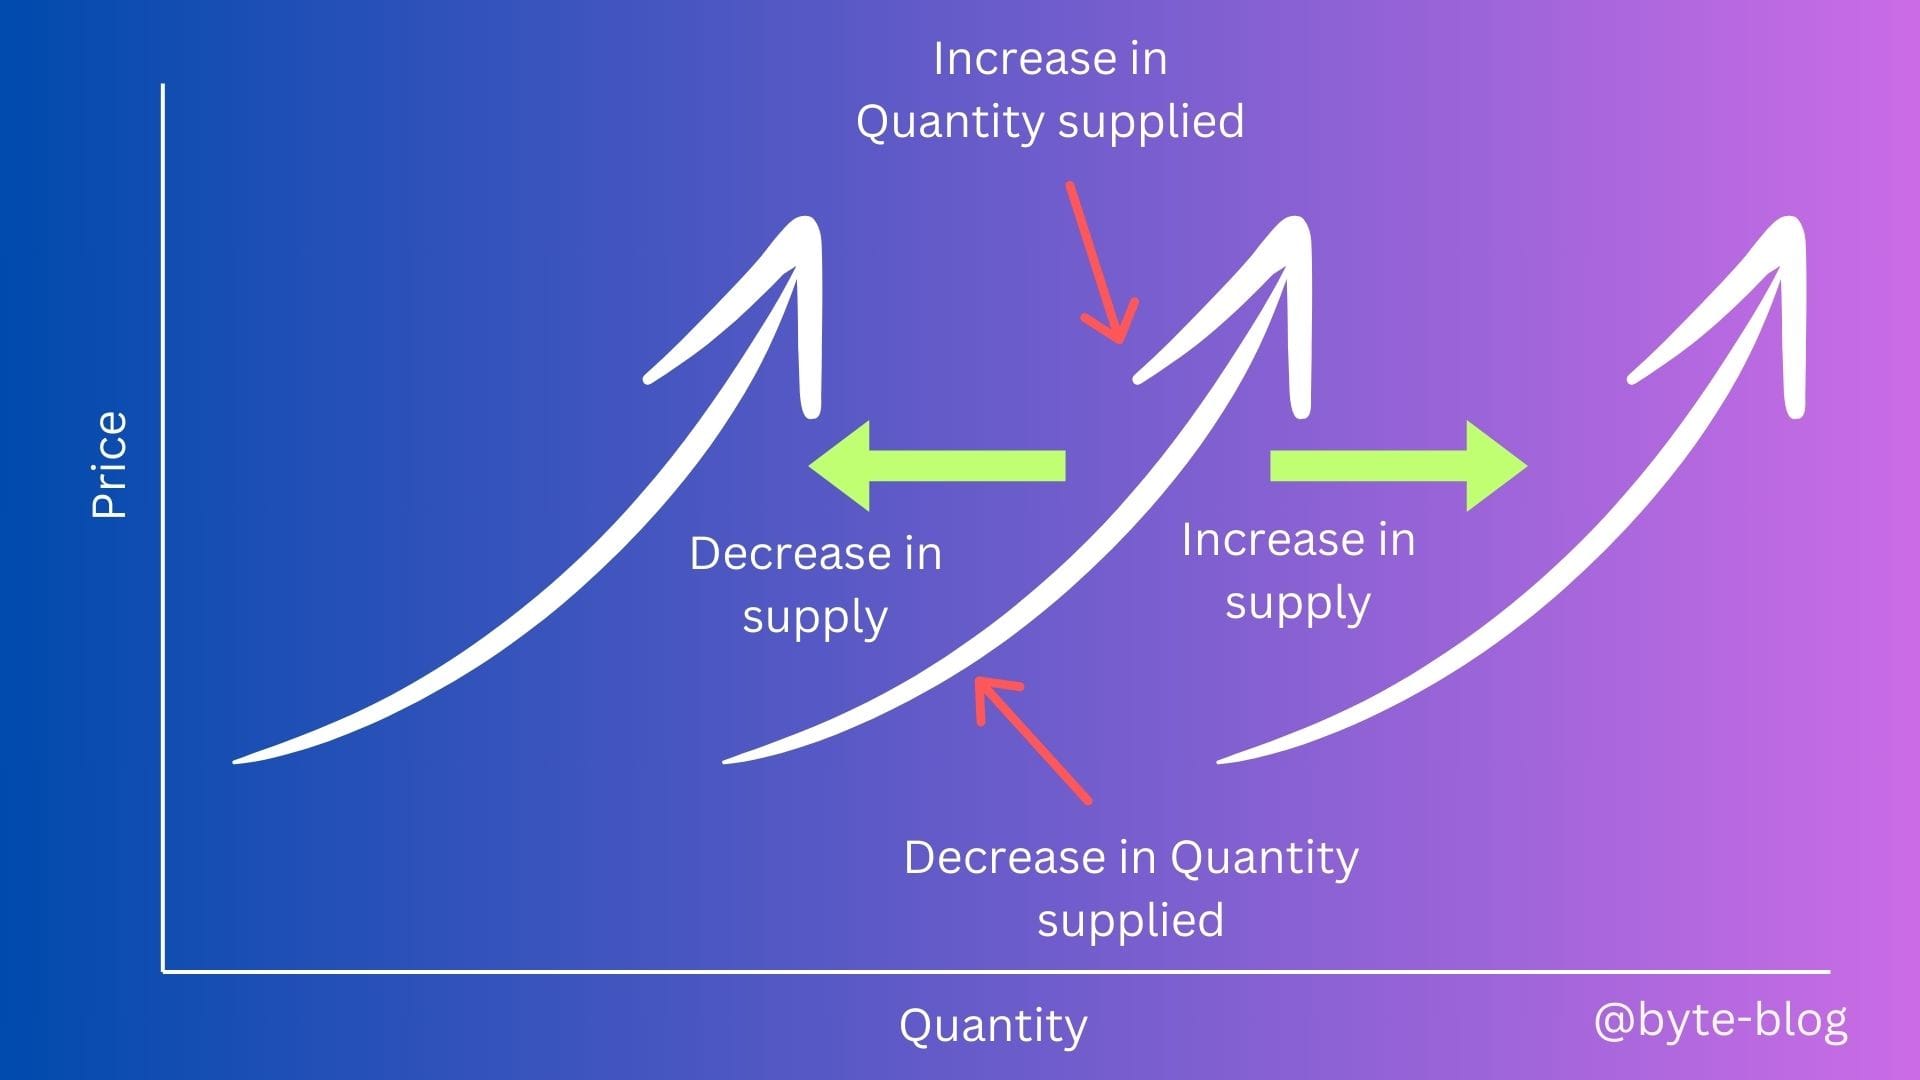
When the price of a good or service changes, the movement takes place along the supply curve & a change in the quantity supplied shown by the red arrows on the supply curve.
When any other factors other than price changes, there is a shift in the supply curve & a change in supply as shown by the shift rightward if the supply increases & leftward if the supply decreases.
Now that we know changes in supply can arise due to price &/or other factors. But by how much does the supply change? Is there a substantial change in supply or is it negligible?
We will discuss this next under Elasticity / Inelasticity of Supply
Elasticity / Inelasticity of Supply
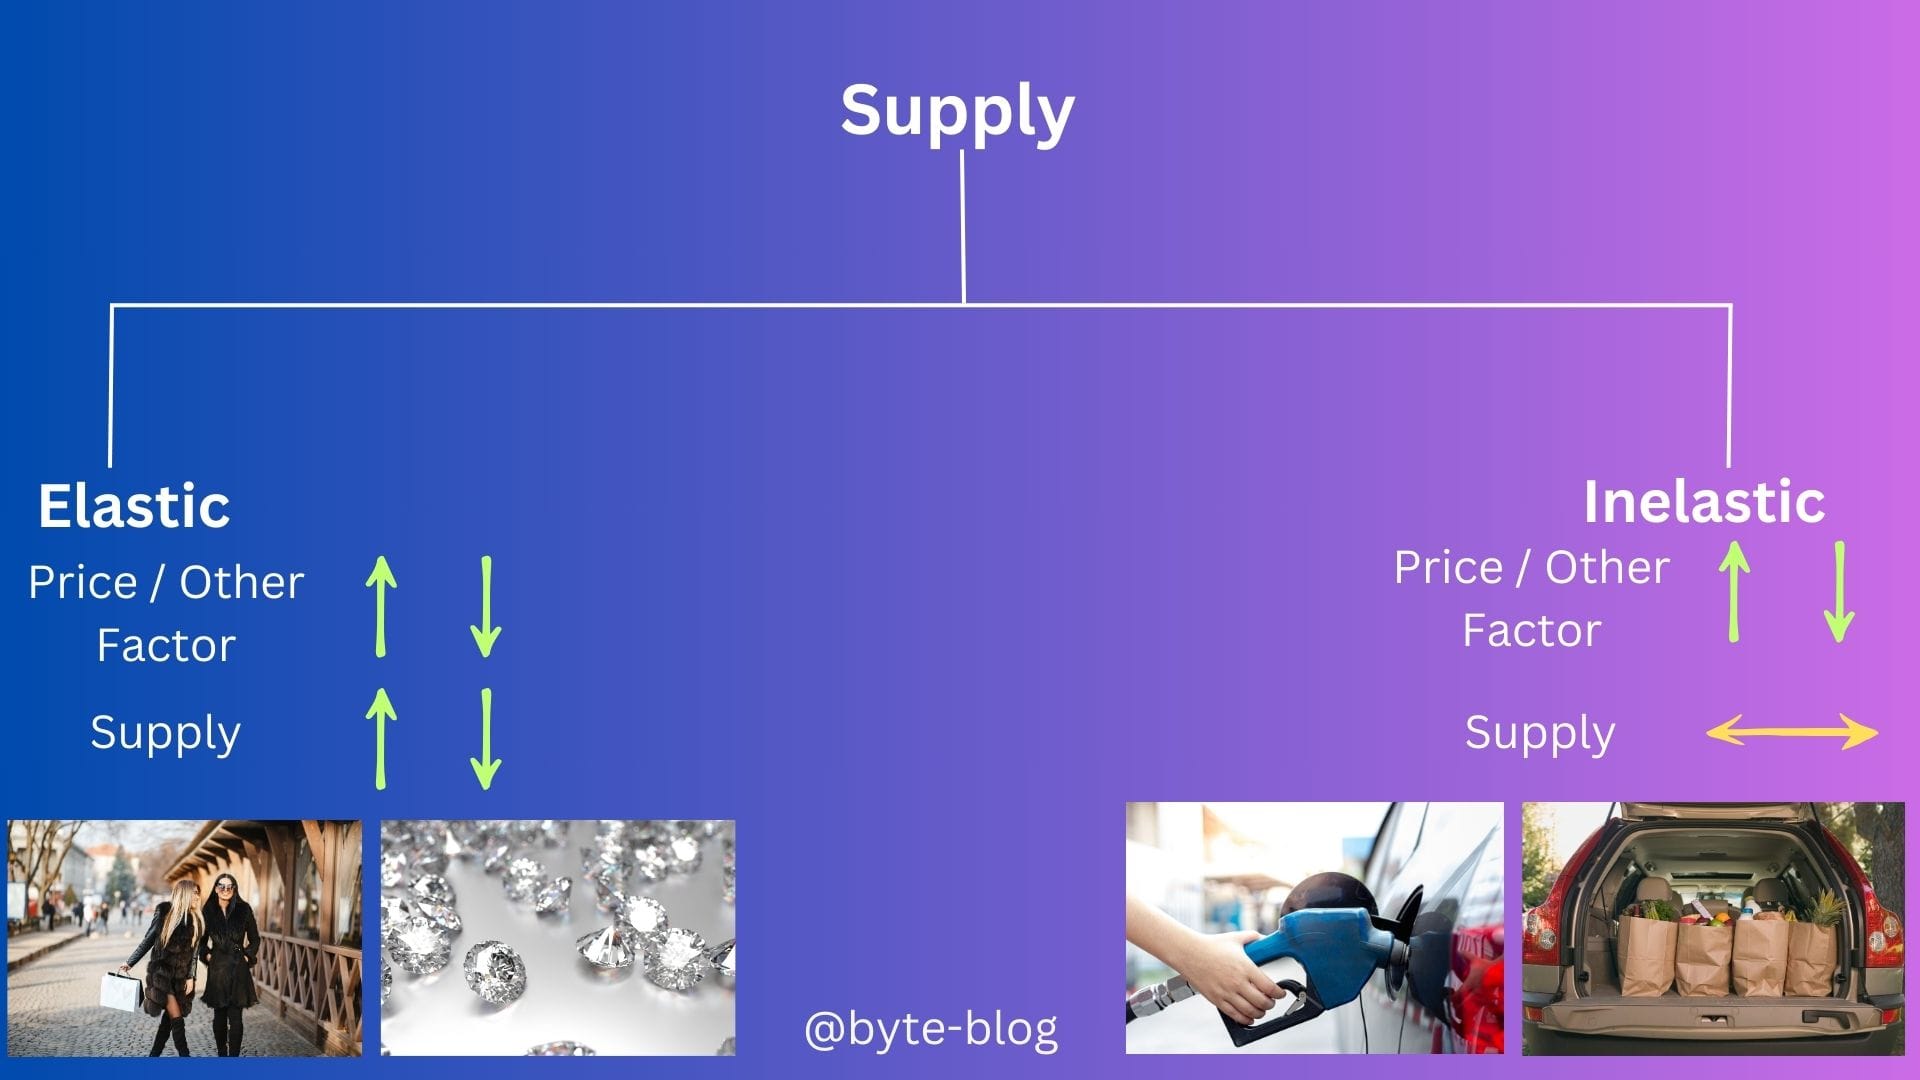
Elasticity of supply is a measure of the degree of change in the quantity supplied of a product in response to a change in its price. (Source : here)
When a change in price or other factors leads to a significant change in supply, such goods are referred to as Elastic Goods. E.g., In a growing economy where income levels rise, demand for certain products rise & hence suppliers can increase supply & price in line with demand.
But in a recessionary environment, consumers tend to spend less & discretionary spending is the first to be chopped off the spending list leading to reduced demand for such goods or services. This causes prices to fall resulting in producers reducing production & supply.
Where a change in price or other factors does not lead to a significant change in supply, such goods are referred to as Inelastic Goods. E.g., irrespective of whether the economy is booming or in recession, there are certain necessities which consumers will buy whatever the price is like gasoline, groceries etc where the production or supply cannot be reduced.
The below visualization summarizes the above :
Now that we have tackled both supply & demand, what happens when they two meet? Let us discuss this in the context of real estate supply & demand, which is very close to our hearts & is an important sector in an economy.