Strategy Byte - Week 53 - Competition & Profitability

Table of Contents
- Recap
- Porter's Five Forces
- Industry Profitability
- Industry Profitability Variations
- Source Link
Recap
During Week 52 of Strategy Bytes, we deep dived into the Automotive industry. We started from the top of the Pyramid (inspired from Barbara Minto's Pyramid Principle) & going down step by step along the value chain understanding the various players & their market size.
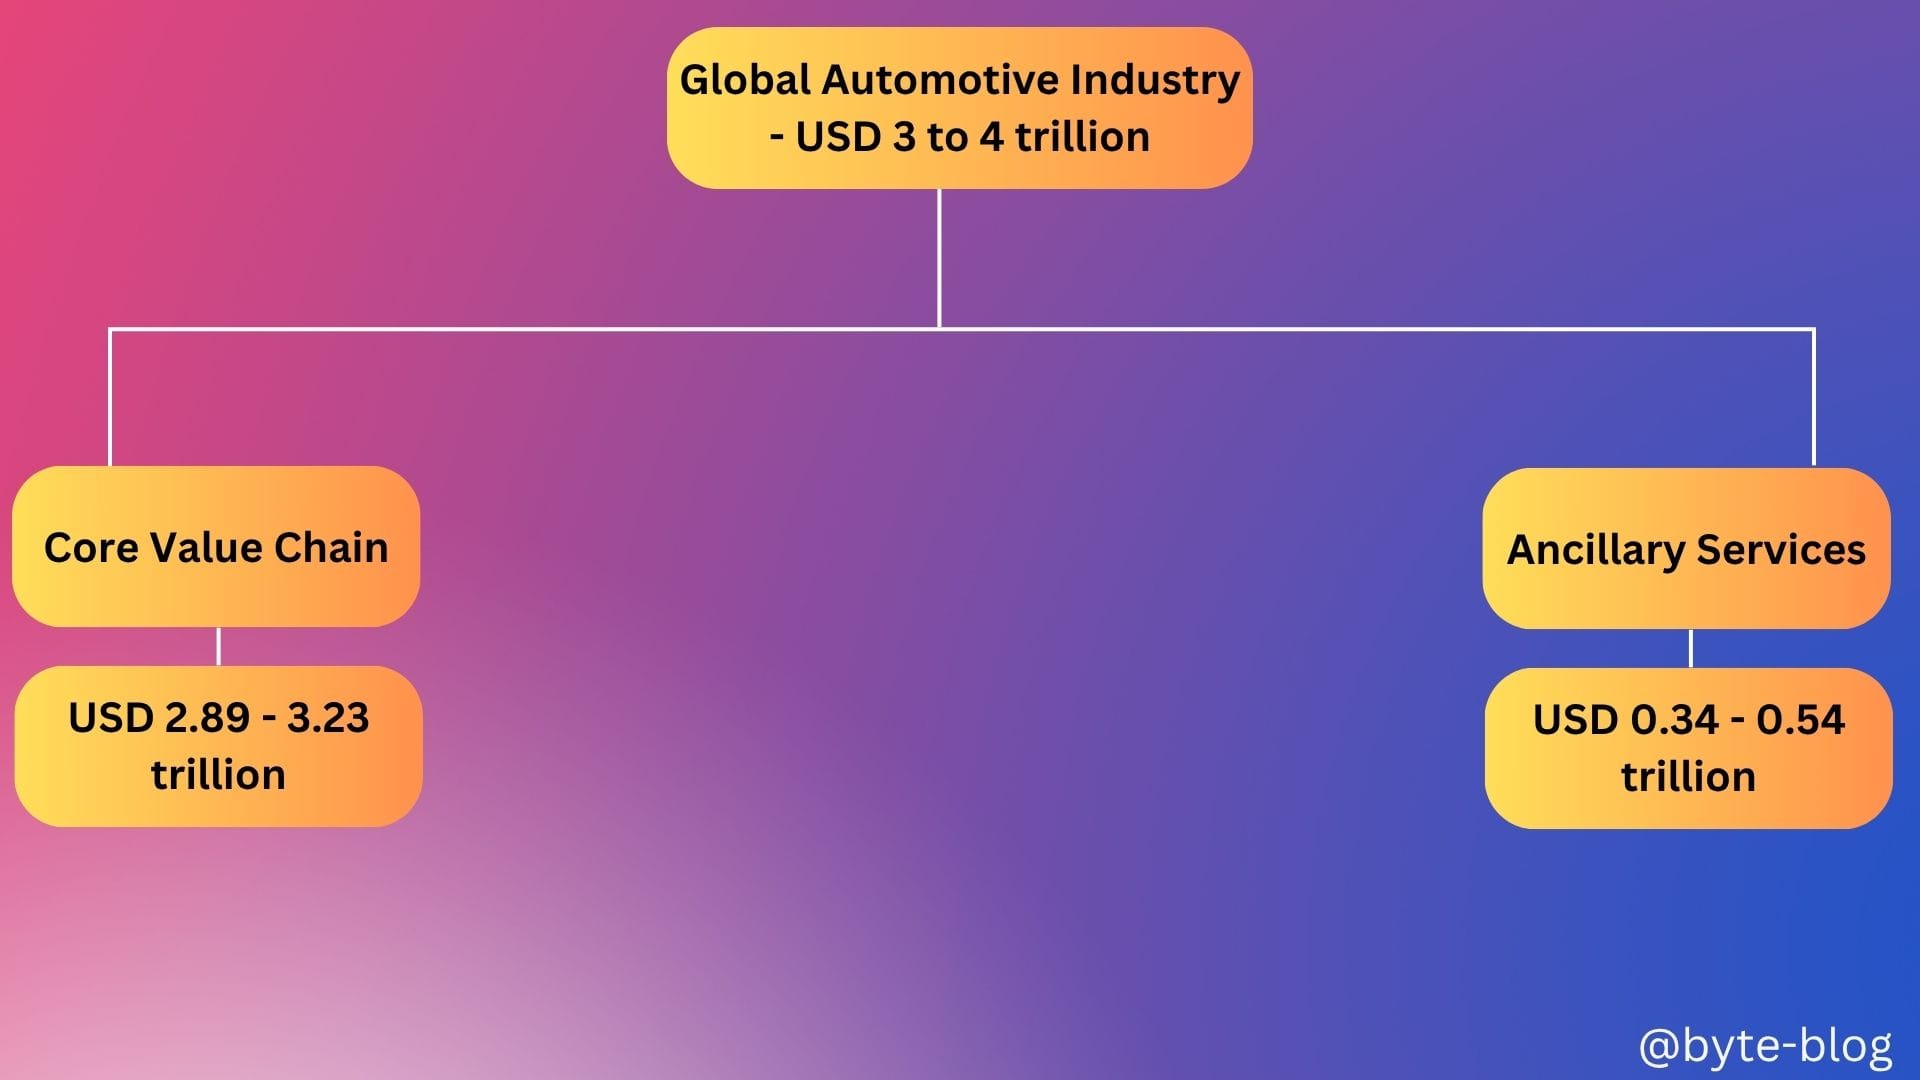
We started with the overall automotive industry market size at USD 3.4 trillion encompassing the total value chain from design & engineering to distribution & after-market services (please refer Week 52 "References section" for more information).
We then divided the total industry value chain into :
- Core Value Chain &
- Ancillary Segments
Core Value Chain relate directly to building, engineering & shipping vehicles. This segment accounts for nearly USD 2.89 to 3.23 trillion out of the total value of USD 3.4 trillion.
Ancillary Segments relate to the wide array of ancillary & adjacent sectors not included in the core value chain breakdowns such as automotive retail & dealership, aftermarket services (maintenance, repairs, parts, accessories), automotive finance & insurance, road infrastructure & tolls, leasing & rental services, used vehicle markets etc.
This segment contributes nearly USD 0.34 - 054 trillion which are essential to the functioning of the automotive industry but are not part of the direct manufacturing & supply chain.
Visualizing the above :
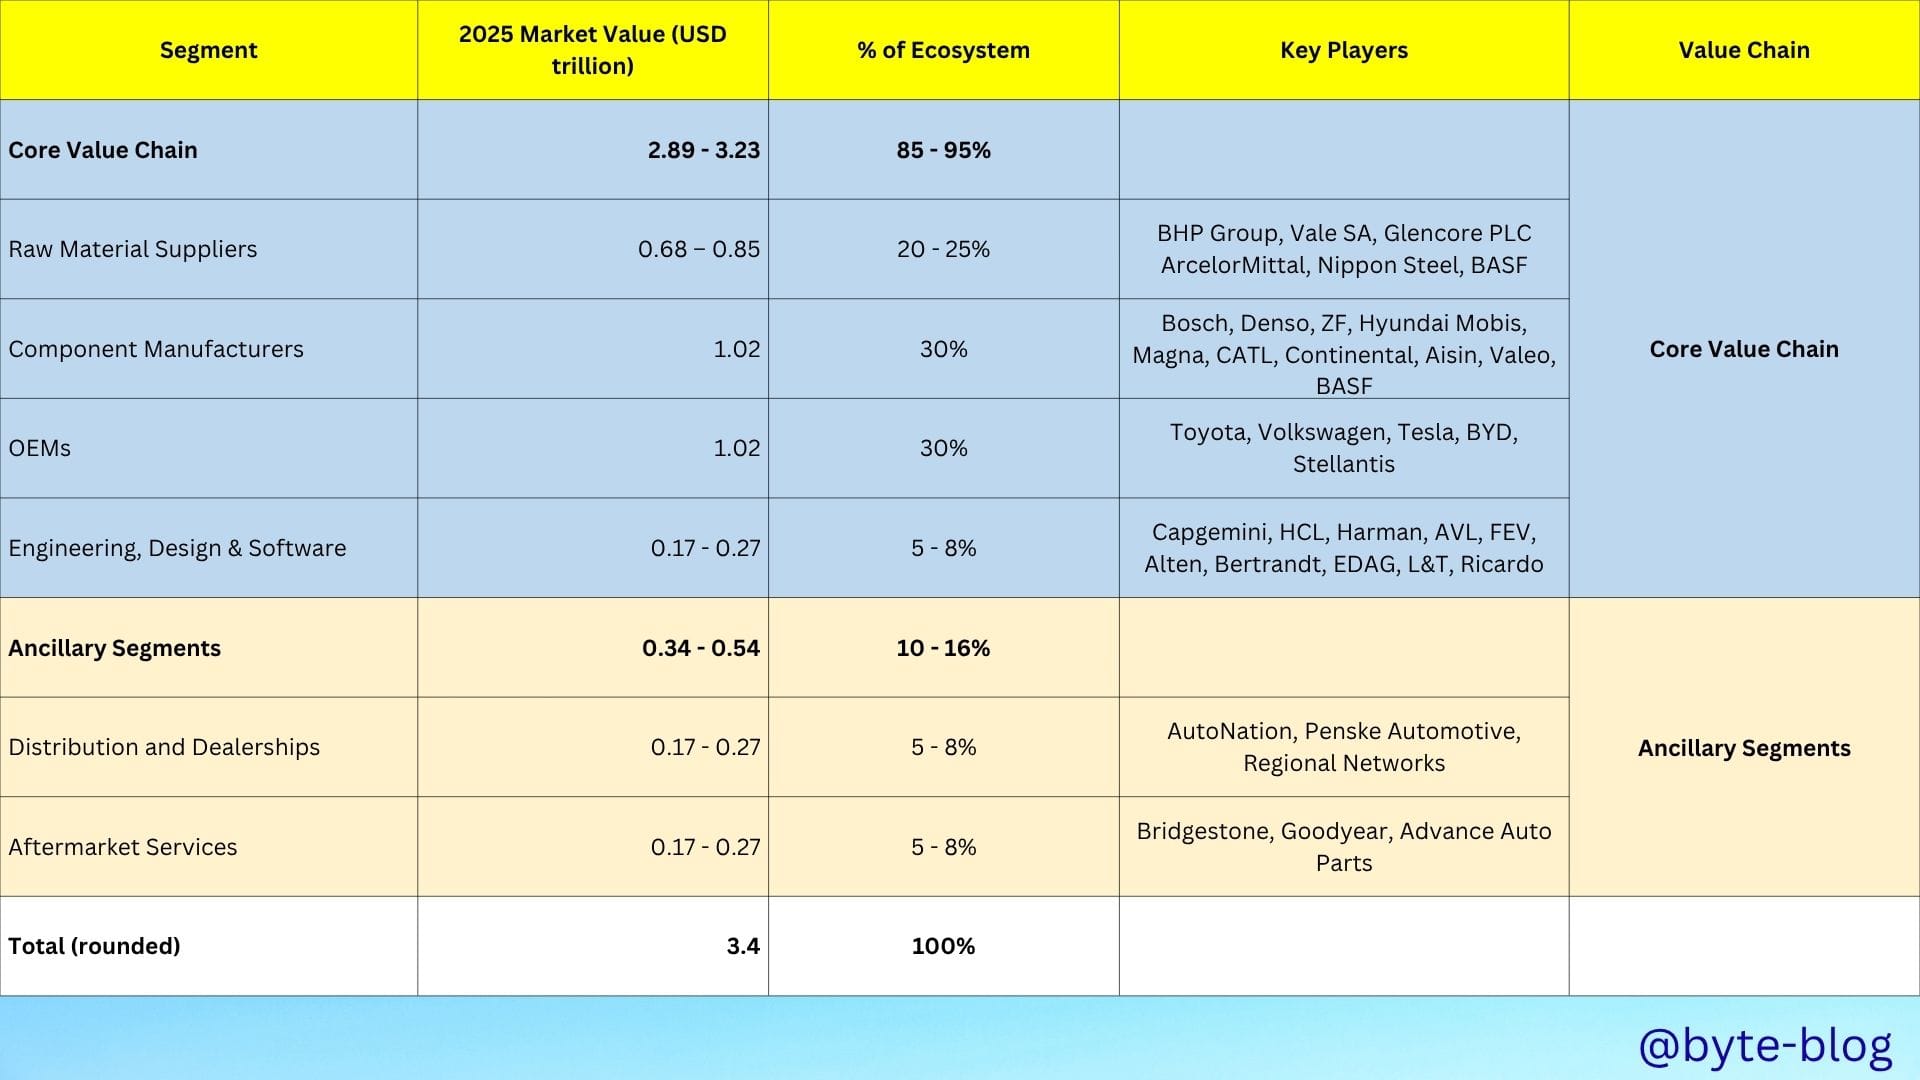
Then we explored further into the market share of individual parts of the value chain as below :
We analyzed each segment to understand the concentration (figuring out who are the top 10 players & their market share under each segment). We ended up with the below visual :
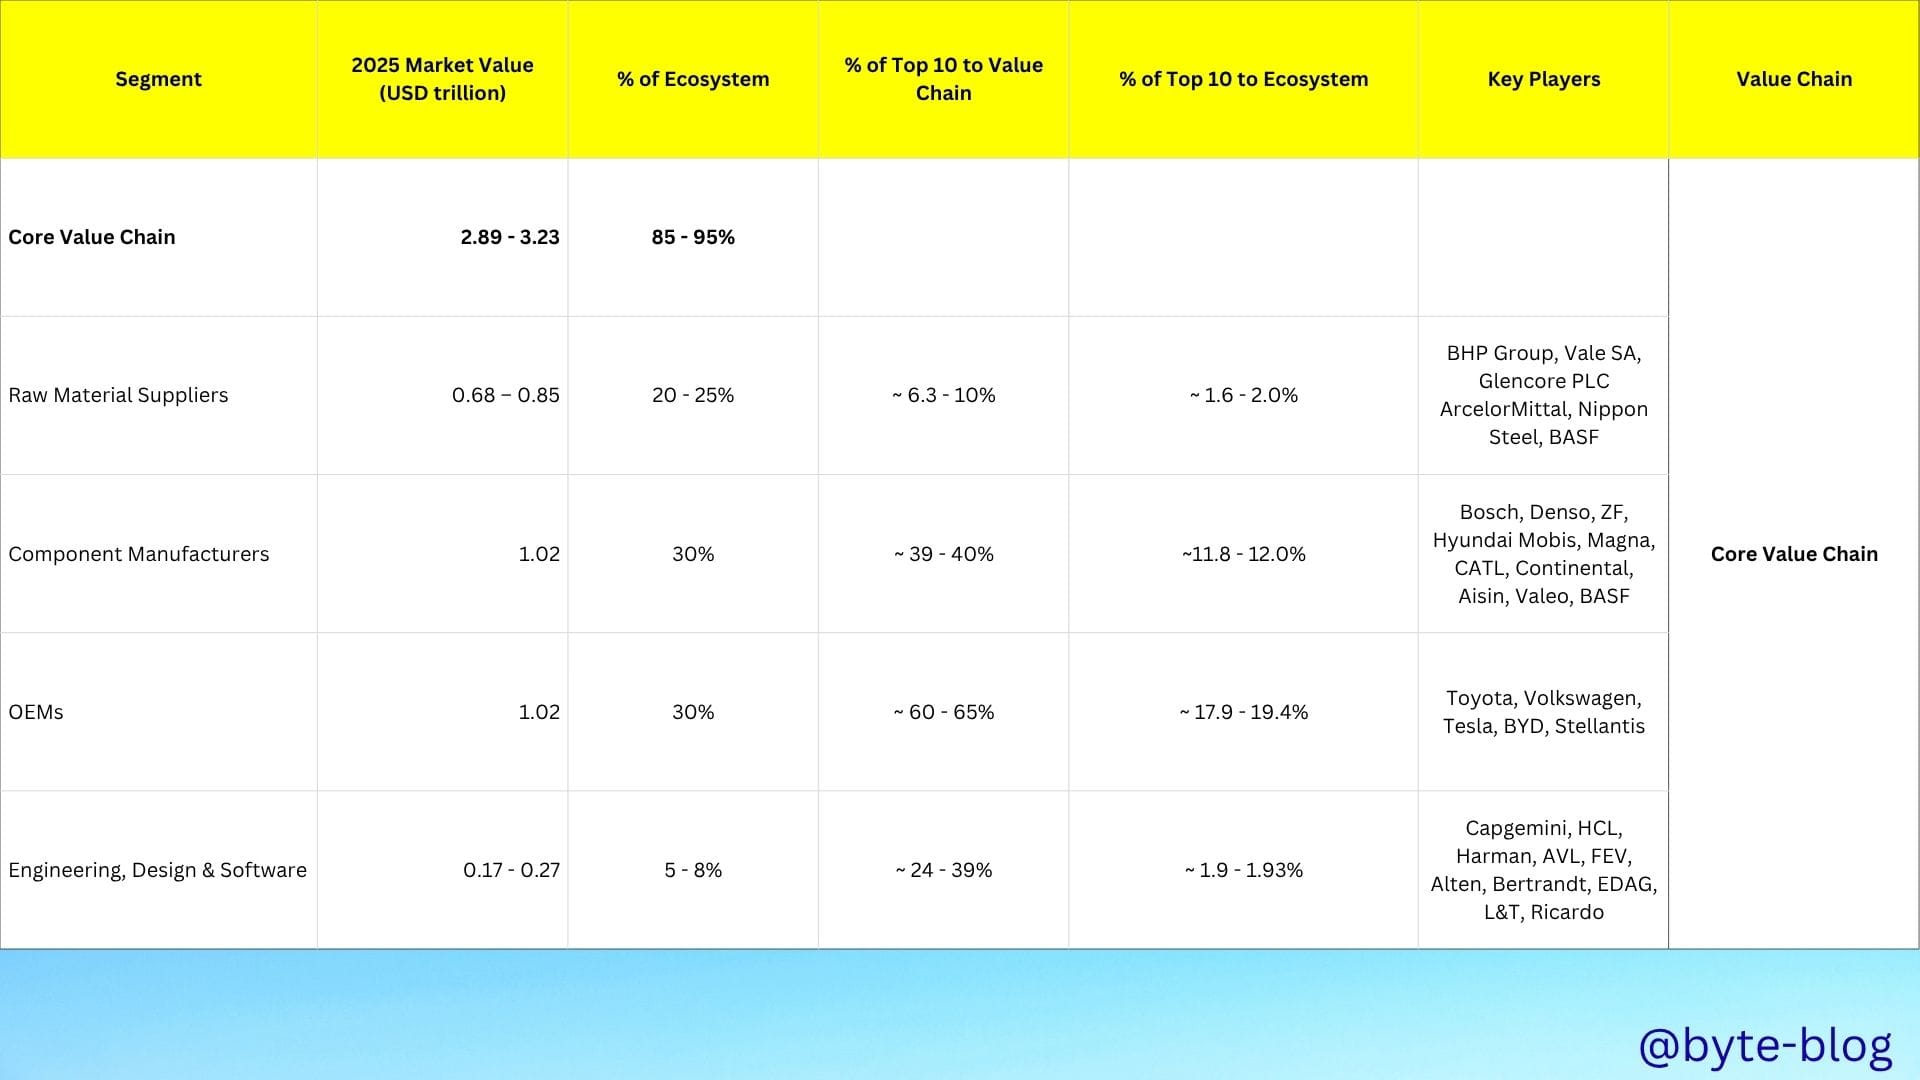
We summarized the discussion as below :
- The top 10 OEMs hold ~60–65% of the OEM segment.
- The top 10 suppliers contribute USD 53.5–69.0 billion (~6.3–10.1%) of the USD 0.68–0.85 trillion segment, reflecting its fragmented nature compared to Component Manufacturers due to the fragmented nature of raw material supply, with many players serving multiple industries
- The top 10 component manufacturers hold approximately 39–40% of the Component Manufacturers segment (USD 0.40–0.41 trillion of USD 1.02 trillion), driven by their scale in EV batteries, electronics, and powertrains.
- The top 10 Engineering , Design & Software providers hold ~24–39% of the Engineering/Design/Software segment (USD 63.3–65.6 billion, ~1.9–1.93% of USD 3.4 trillion), driven by demand for EV and ADAS solutions
Why did we focus on concentration in our discussion last week? Let us see the reason now....
Porter's Five Forces
Let us rewind back to Week 46 where we introduced Porter's Five Forces with the below visual :
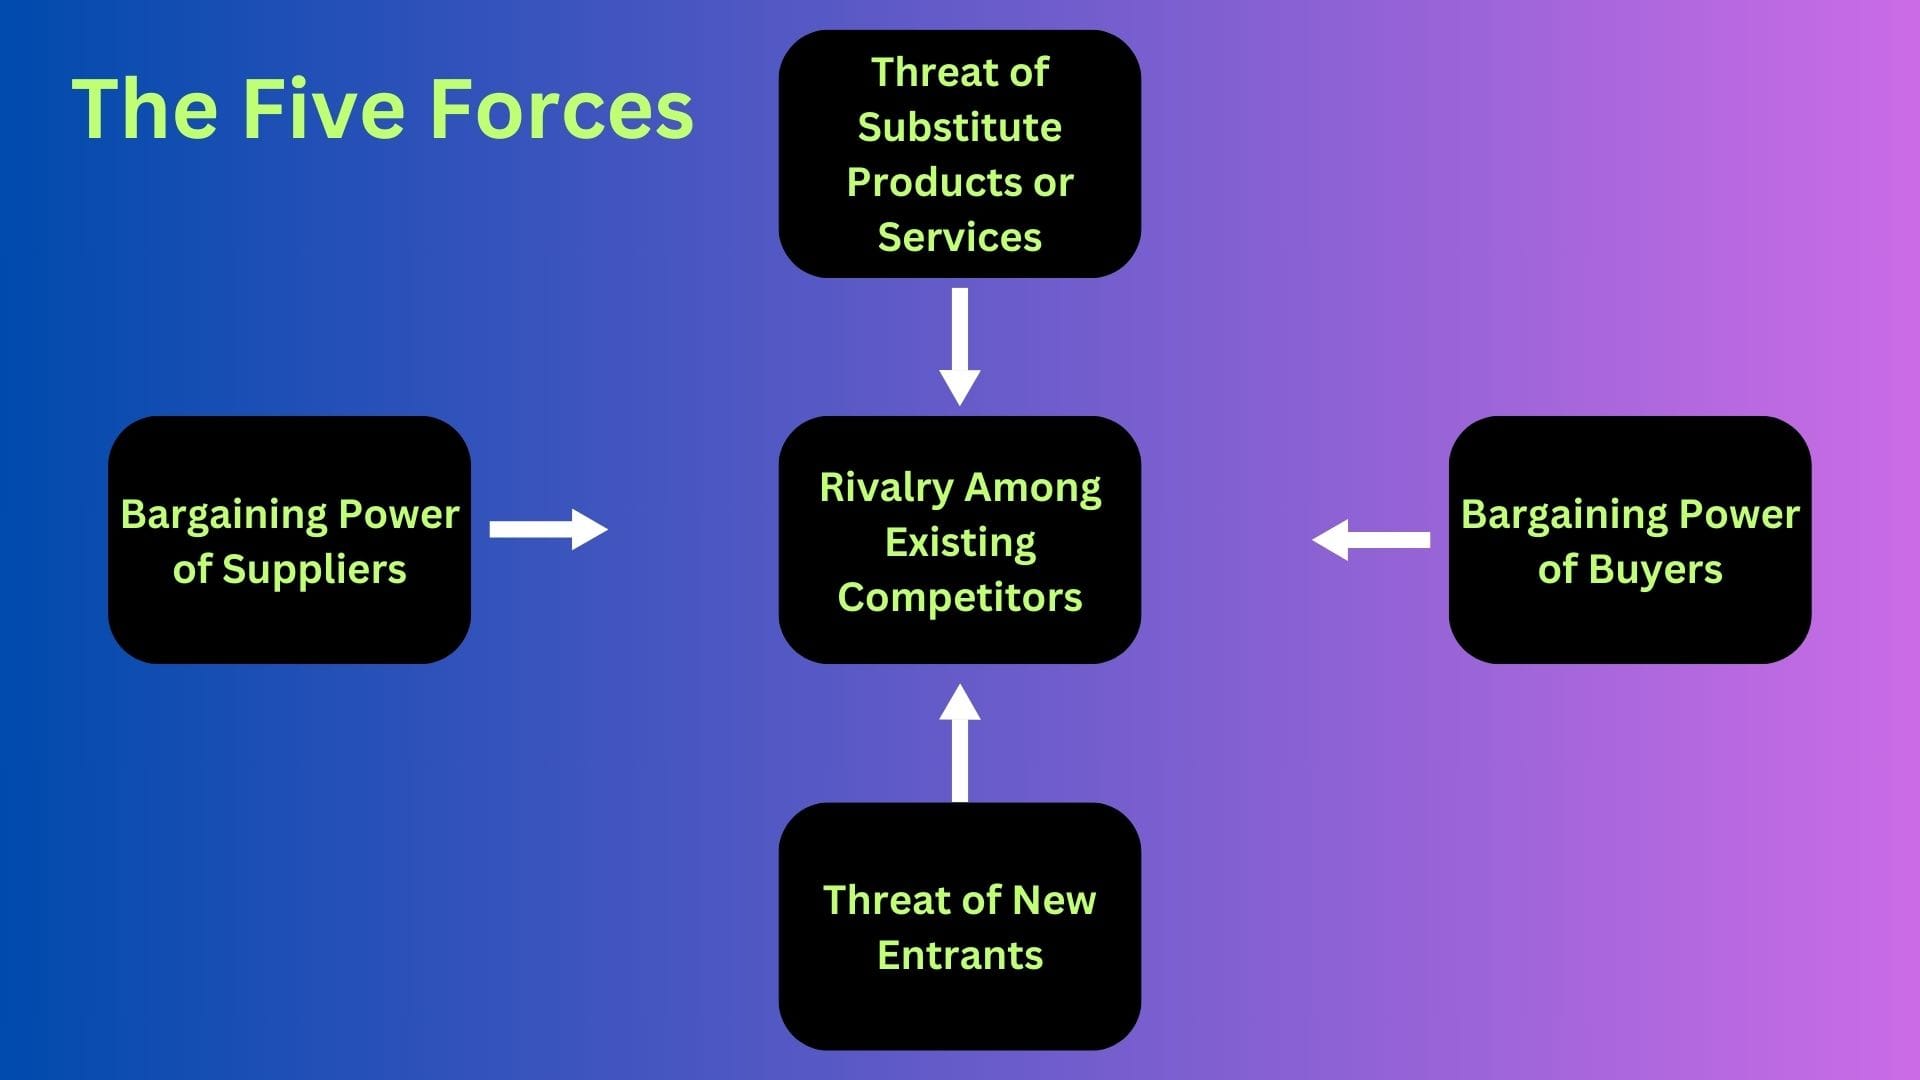
We emphasized something called "the mindset" to understand the five forces as below :
- Mindset - 1 : Environment - where a company understands it's external environment (Overall environment (PESTEL) + Industry) &
- Mindset - 2 : Tension - where each of the five forces above causes a tension between the below two parameters of any company :
- Revenue &
- Costs
All companies try to maximize revenue with minimal costs.
Visualizing the above :
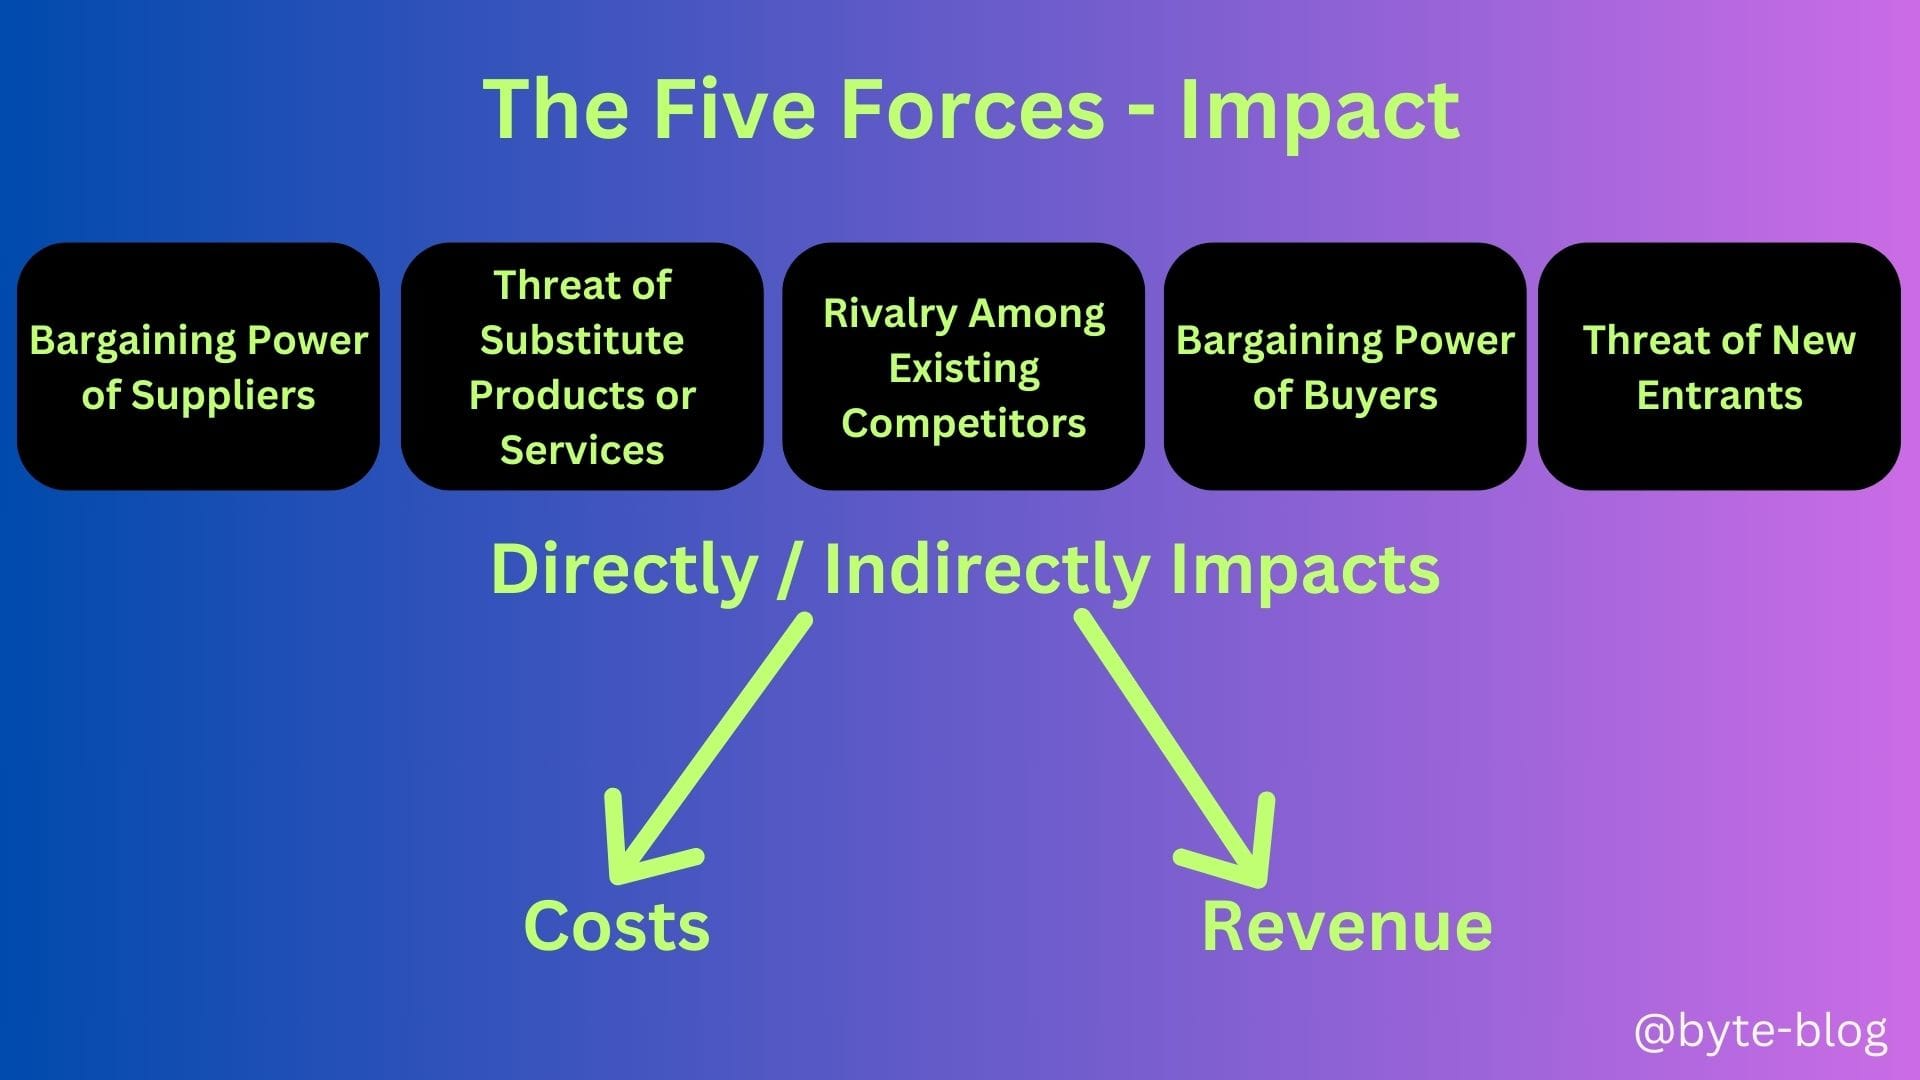
This week we focus on Mindset 2 to understand how competitive forces affect the profitability of any industry.
Industry Profitability
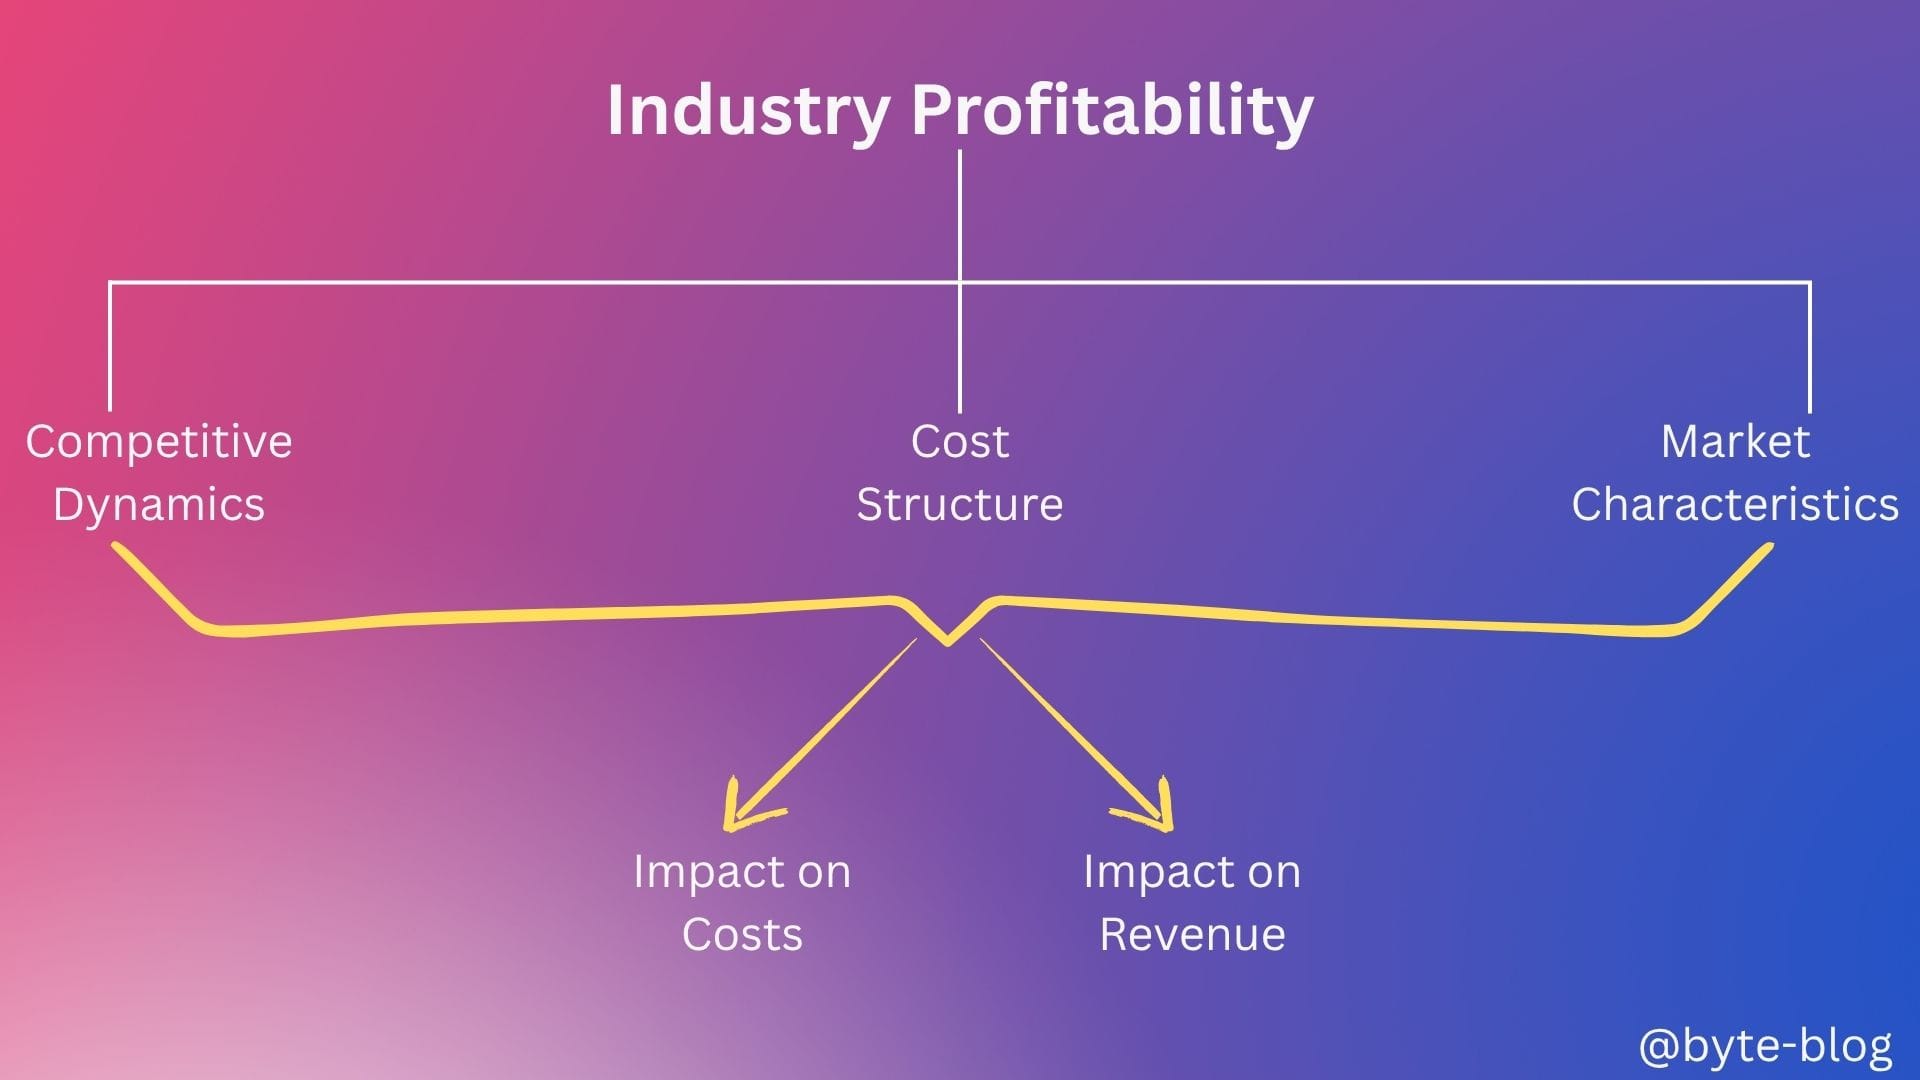
One key point that we need to understand is that different industries have different profitability levels. Why? That is because of structural differences in :
- Competitive dynamics
- Cost Structure &
- Market characteristics
(Source : here)
Let us analyze the above through it's impact on costs & revenues.
Impact on Costs
Each company has a cost structure dependent on the industry which is in turn is dependent on the value chain, production & supply of a product or service etc.
Certain industries require high upfront investments in manufacturing facilities (like automotive & other heavy industries) while certain other industries (like software) does not require high upfront investments.
The sales volume & pricing required to absorb high upfront costs will be different compared to industries with little or no upfront investments. This makes the cost structure different for different industries.
Also, if a competitor has better cost structure due to efficiencies which gives them more room to bring down pricing or increase the quality of their products or services, that puts pressure on other companies within that industry to either be more efficient in their operations or close down.
Impact on Revenue
The volume & value of products or services sold by the company within an industry depends on the pricing, market share, customer segmentation, demand for the product or service etc.
On market characteristics, more competition puts pressure on pricing which in turn impacts the revenue generating capacity & ultimately the profitability of the companies in that industry.
Visualizing the above :
With the above in mind, let us now have a look at actual numbers.
Industry Profitability Variations
There are substantial differences in profitability levels across industries. For ease of discussion, let us divide the industries into two :
- High Profitability Industries &
- Low Profitability Industries
High Profitability Industries
Software & technology companies consistently demonstrate the highest profit margins, with software companies achieving net margins of 19 - 40%.
Financial services also rank among the most profitable sectors, with banks (regional) showing gross profit margins of 100% and asset management companies achieving 80.7% gross margins.
Investment banking and securities dealings top the profitability charts with remarkable 57.1% net margins.
Healthcare and pharmaceuticals represent another highly profitable sector, with drug manufacturers achieving 72.9% gross margins. The industry benefits from patent protection, specialized expertise, and inelastic demand for essential health services.
Low Profitability Industries
Conversely, certain industries operate with significantly lower margins. Manufacturing sectors such as auto manufacturers show only 10.3% gross margins, while oil and gas refining achieves just 9.3% gross margins.
Agriculture-based and transportation industries also typically experience lower profitability due to high operational costs, volatile input prices, and intense competition.
Source Link
The source link for the above numbers is here.
We will continue our deep dive into the automotive sector to understand the underlying reasons for high or low gross & net margins next week.