Finance Byte - Week 7 The Income Statement

Table of Contents
- Recap
- Transactions
- Transactions Listing
- Transaction Classification
- Income Statement
Recap
During week 6, we started with the WHY. Why does Jack need to run a coffee shop?
To sell coffee. Why does he need to sell coffee? To earn more revenue.
To earn revenue, he has to incur some costs - cost of raw materials, salaries of baristas etc.
So he earns revenue & incurs costs in the process of earning that revenue. So his net benefit is what he earns over his expenses
Net Benefit = Revenue - Costs
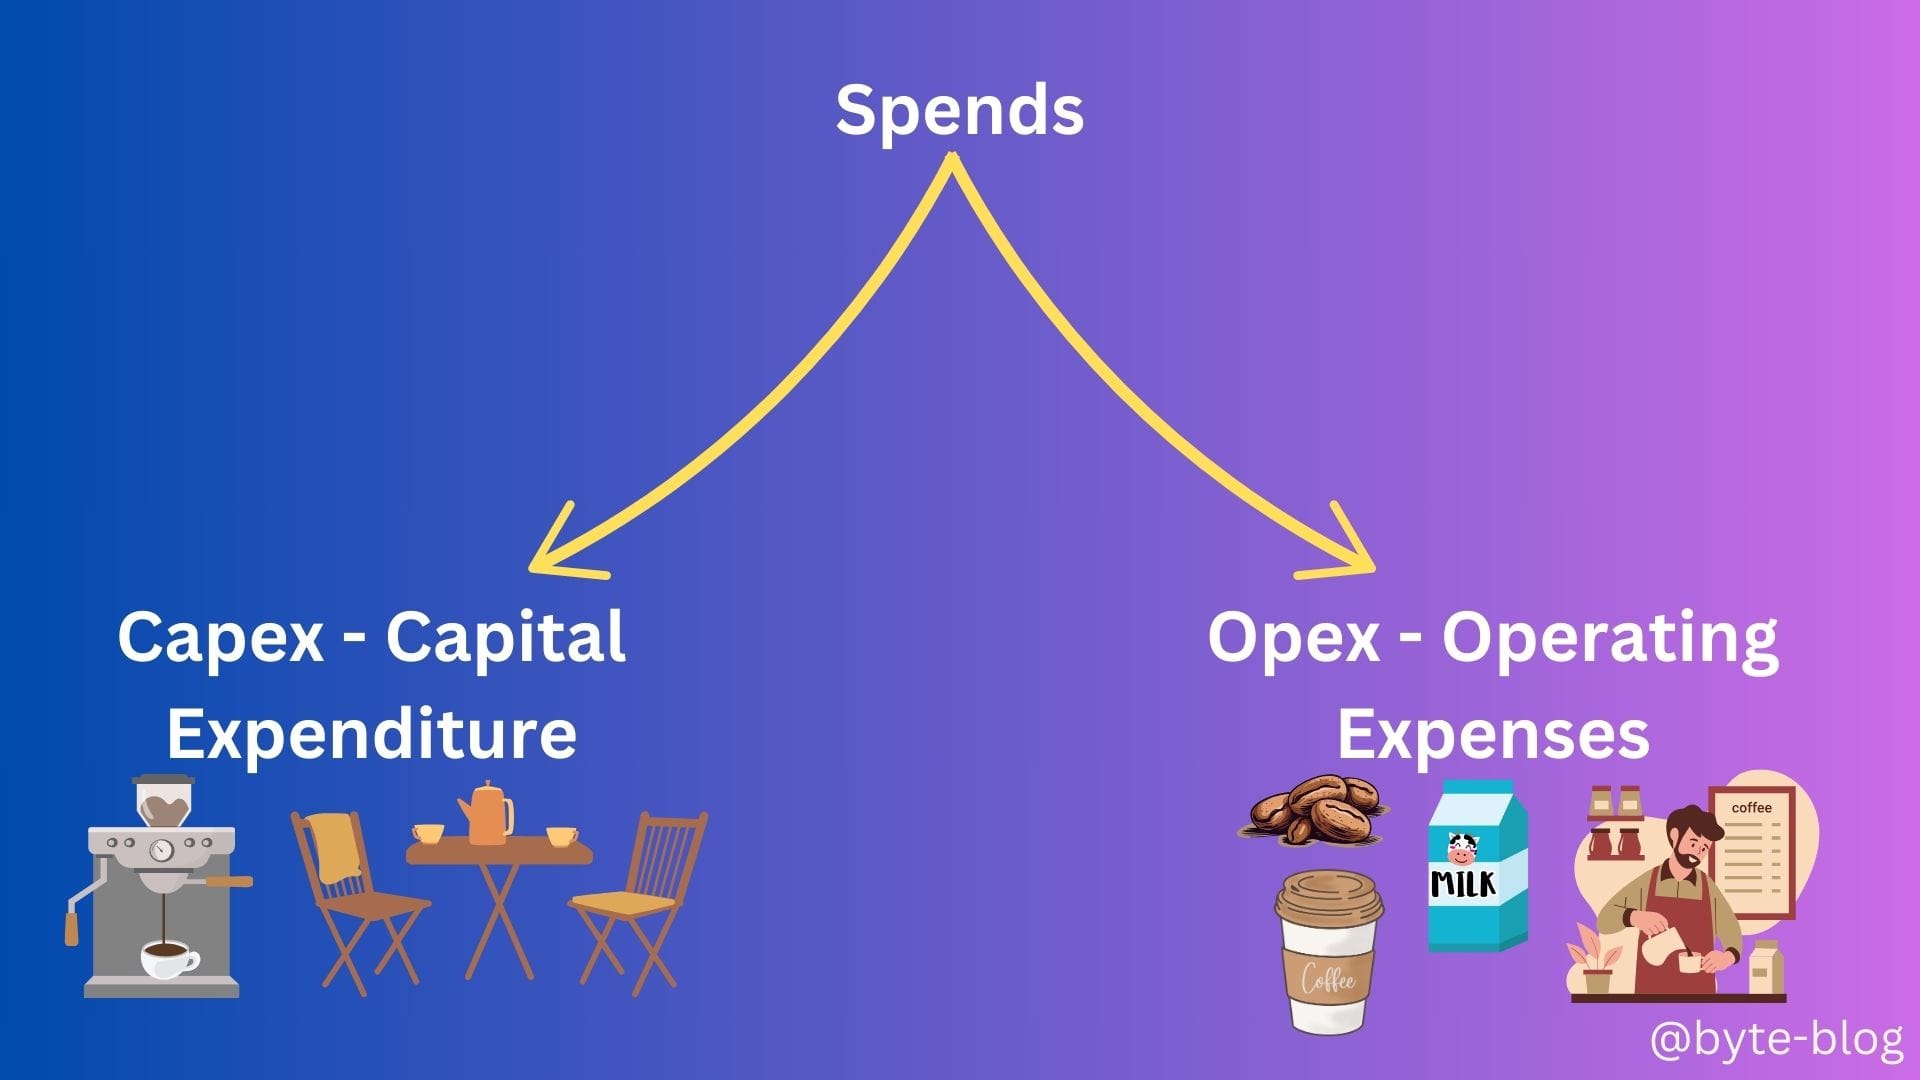
We then classified costs into
- Operating Expenses or Opex &
- Capital Expenses or Capex
We defined Opex as :
Costs incurred by a business for it's operational activities . In other words, operating expenses are the costs that a company must make to perform it's operational activities_. (Source : here)
The benefits accrued from incurring these costs are immediate or within the same year (we will define "year" later).
We defined Capex as :
The funds used by businesses to purchase long-term assets intended over continued use. From purchasing new equipment & machinery to investing in research & development, capex is a key component in a business strategy as it helps ensure that a company remains successful over time.
Capex plays an important role in business growth & helps expand operational capacity. (Source : here)
Visualizing the above :
We reviewed what Jack did till now :
- Started a Cafe
- Invested some initial cash
- Incurs operating expenses
- Spent money to buy equipments which is expected to be used over the next couple of years (Capex)
How will Jack tie it all up. Let's dive in
Transactions
We mentioned in Week 4 that everything starts with a transaction. It is the building block of how a business is conducted & source of reporting performance.
For reporting purpose, we cannot take a list of transactions just like that & present it to Jack. Jack will not be able to understand anything other than the fact that the transaction took place & the reason behind that transaction.
We go with the assumption that Jack's coffee shop does not have a credit card swiping machine & customers have to pay for their coffee in cash.
Jack also pays his suppliers in cash.
This is more like a guardrail or to simplify our explanation. We will remove this guardrail as this is not how the real world works.
As everything is in cash, whatever Jack earns should add to the cash balance & whatever he pays should go from that cash & hence reduce the cash balance.
So, its like the below :
Cash Opening Balance - $ 100
Add : Revenue earned from sales - $ 50
Less : Spends on Opex & Capex - ($ 60)
Closing Cash Balance - $ 90
With the above in mind, let us take it step by step :
Transactions Listing
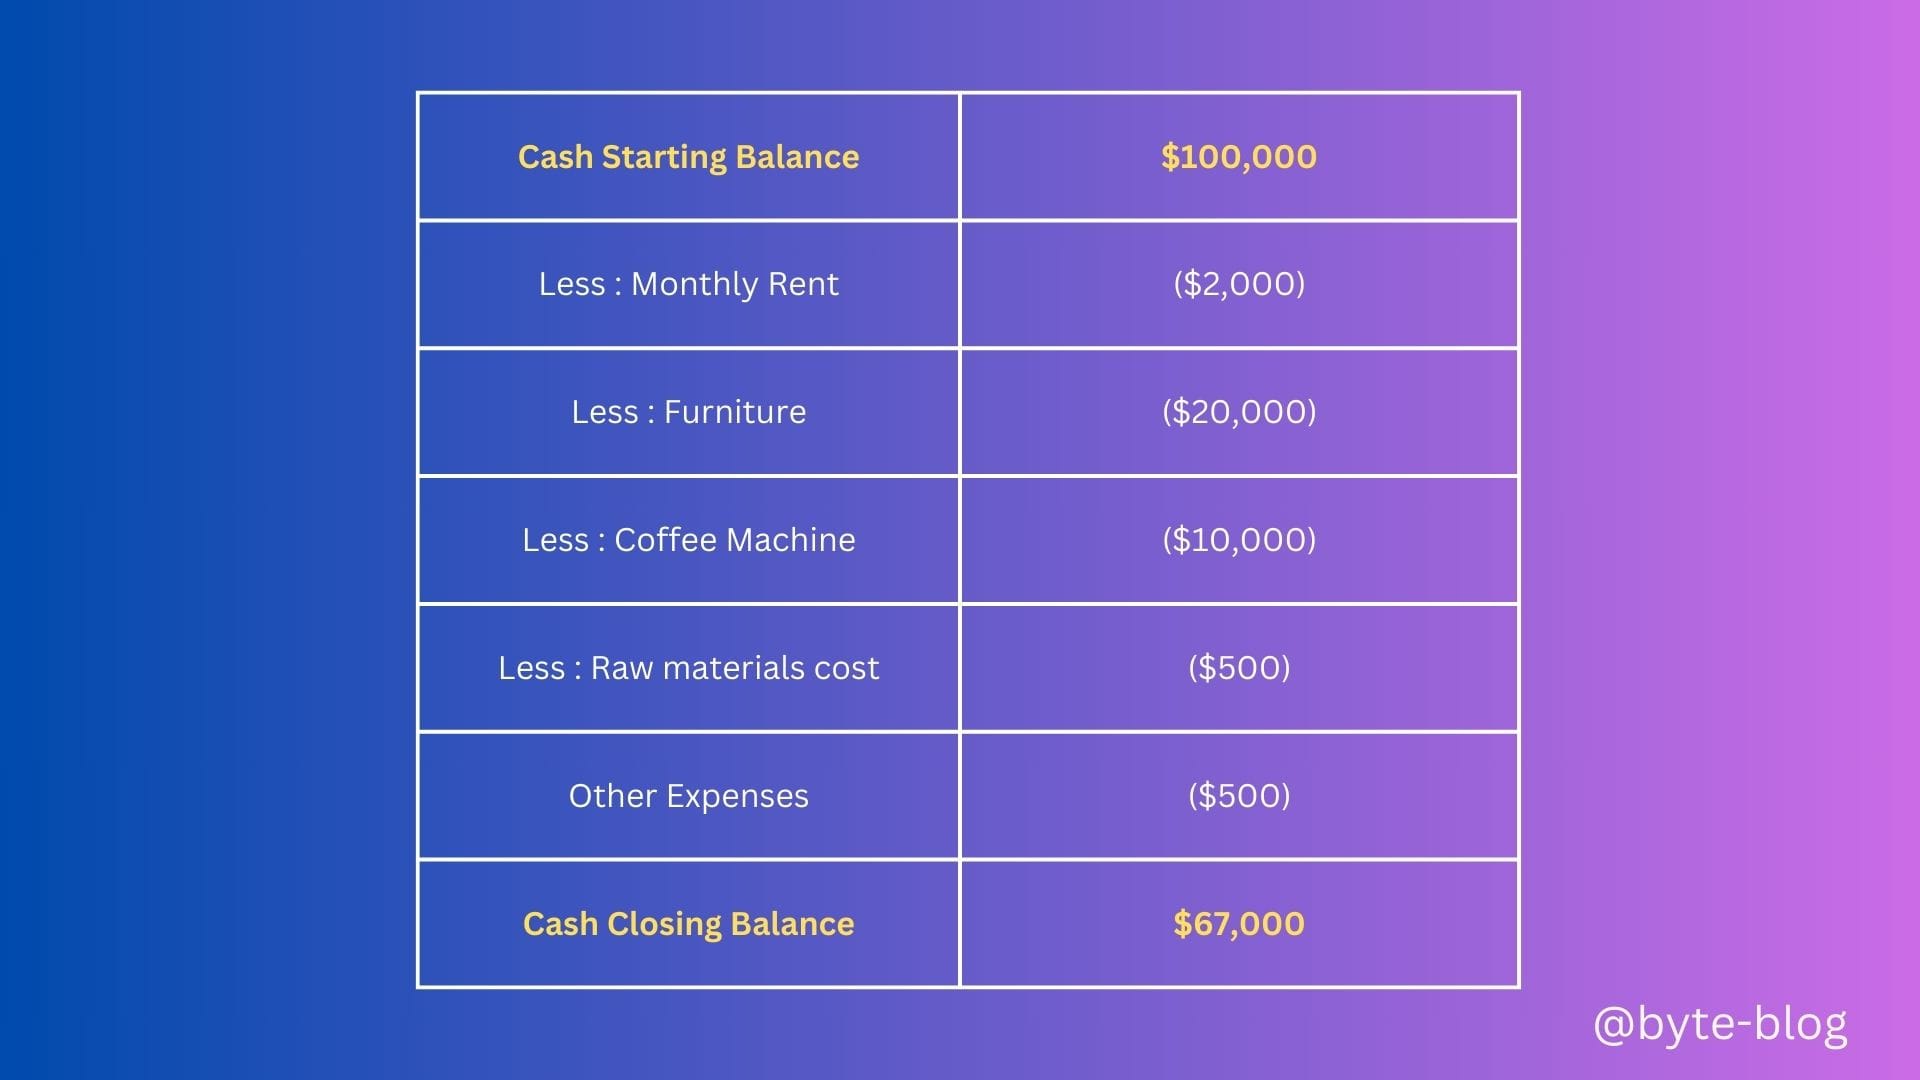
Let us use the same transaction listing that we used in Week 4
Let us now add revenue to the transaction listing. Assume he earns revenue of $25,000. Adding that to our listing above :
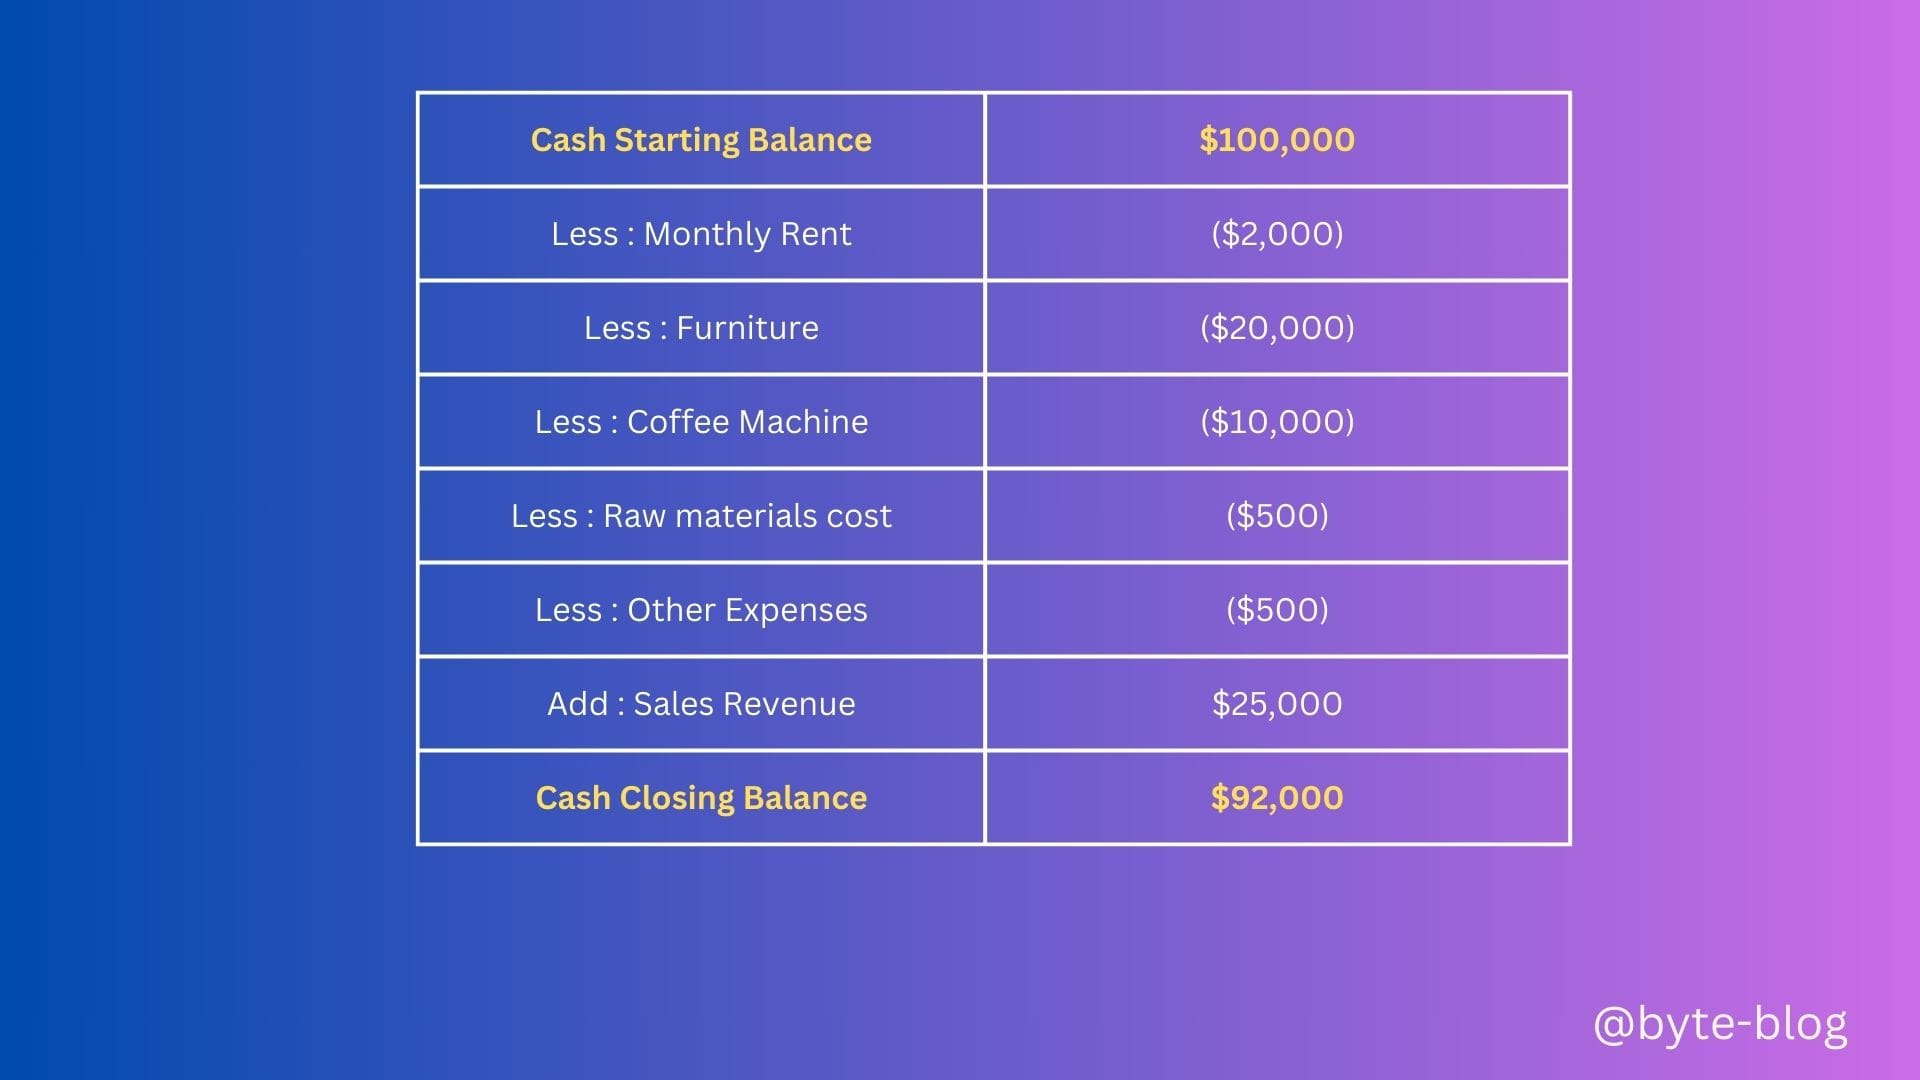
We can see that the cash balance increased by $25k due to addition of revenue.
So, what will Jack make out of these transactions? Nothing much. To make sense of these numbers, they need to float around & form a pattern so Jack can see how his business is performing. Do we have any magic wand for that?

Let us wave our magic wand & classify the above transactions in a way that makes sense to Jack.
Transaction Classification
In a very simplistic sense, we classify transactions based on
- Their nature &
- Their objective
Let us explore them in detail
What is the nature of the transaction ? - Is the transaction
- A revenue transaction meaning incoming cash from customers or?
- An expense transaction meaning amount spent for business? If yes,
What is the objective of the expense ? - Is the expense an:
- Operating expense (Opex) to run the business or
- Capital Expense (Capex) to buy assets
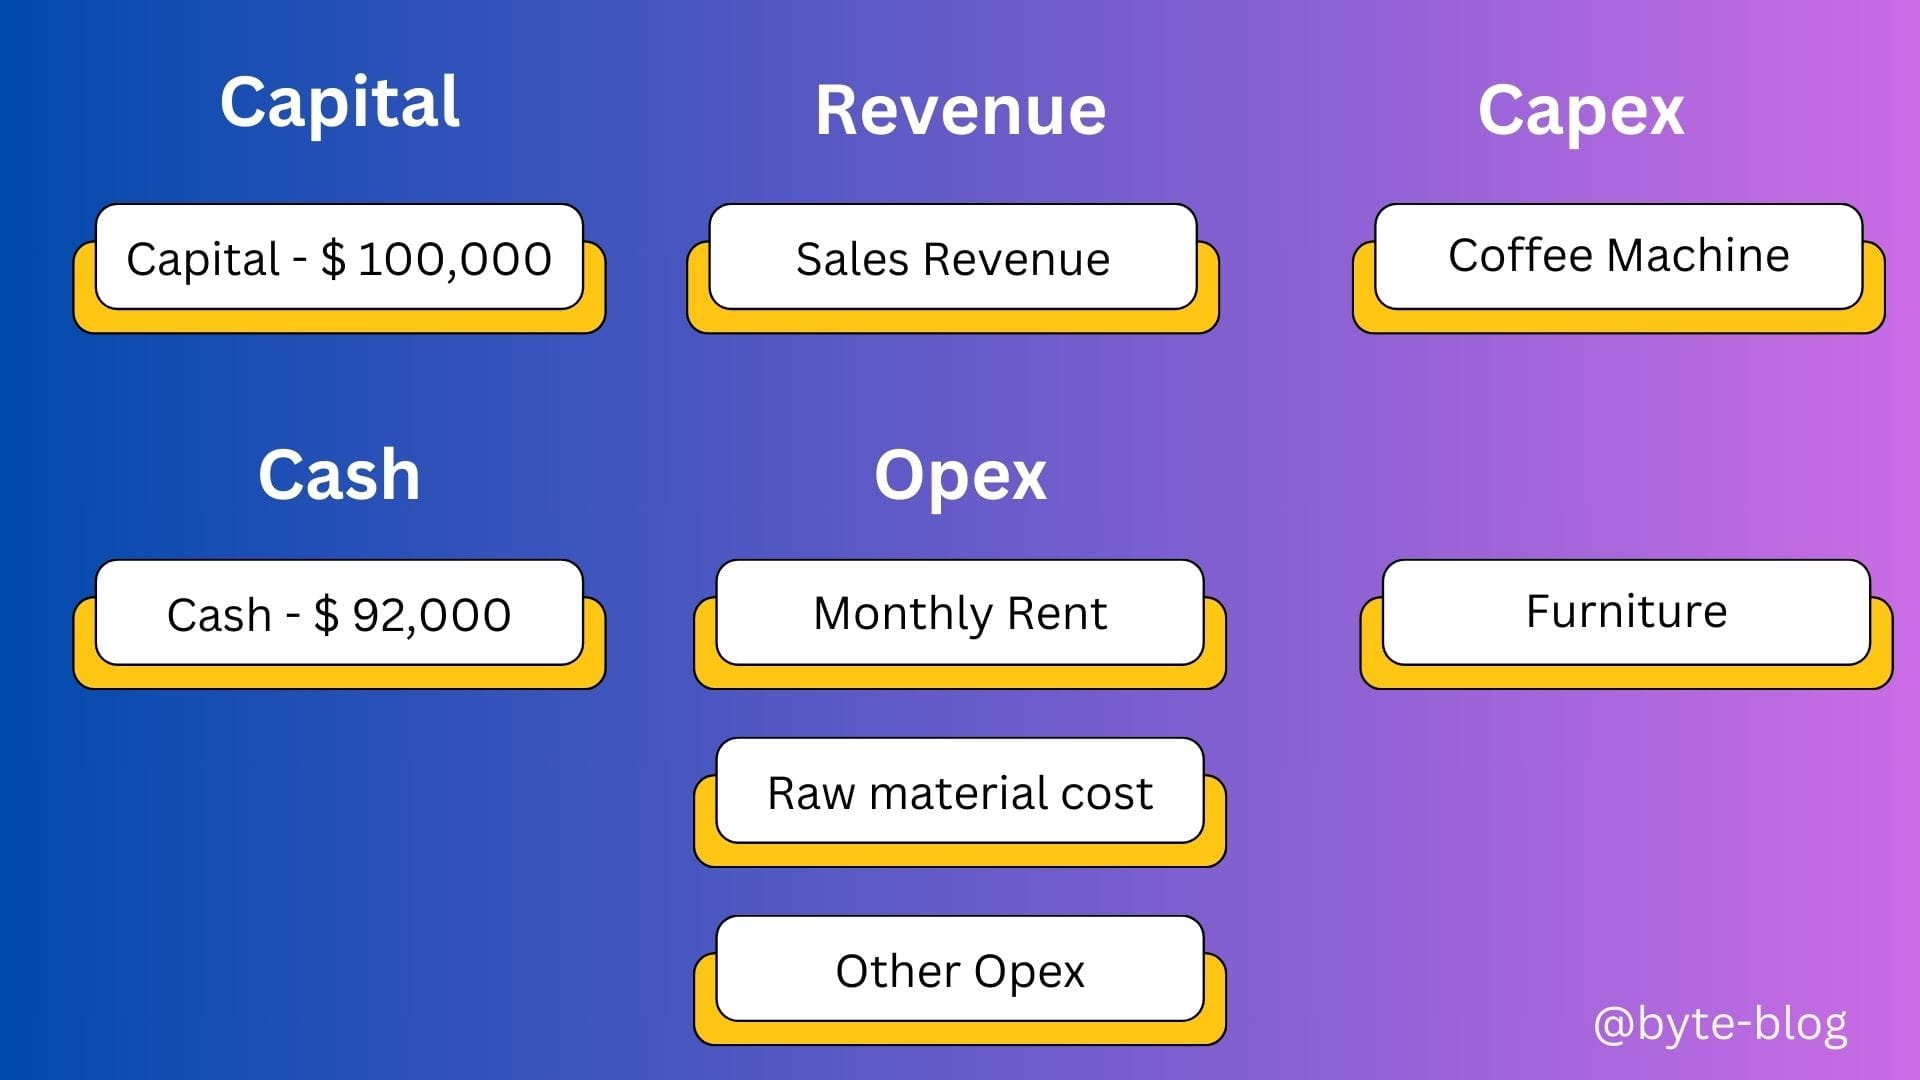
Not all transactions are opex or capex related. The initial amount invested ($100,000) is called "Capital" & also the closing cash in hand will be shown as "Cash".
So, waving our magic wand, let us visualize the classification of the transactions as below:
So, Jack knows that transactions are classified under certain headings based on their nature & objective. What next? Can he still make anything out of it? Not yet. What does he want to know ?
- Is he getting a net benefit out of his business - meaning is he making more money from the business than he is spending &
- Does his business have the necessary means to survive in the future ? Not only survive but also thrive. For that he needs to ensure growth & he makes the necessary investments to ensure it is able to handle increase in demand.
- Is there sufficient cash balance &/or cash generating capabilities to ensure he is able to make payments critical to running his business & also he has processes in place to ensure he is alerted to any cash shortage or expected cash shortage in any future period.
So, lets tackle the first point.
Income Statement
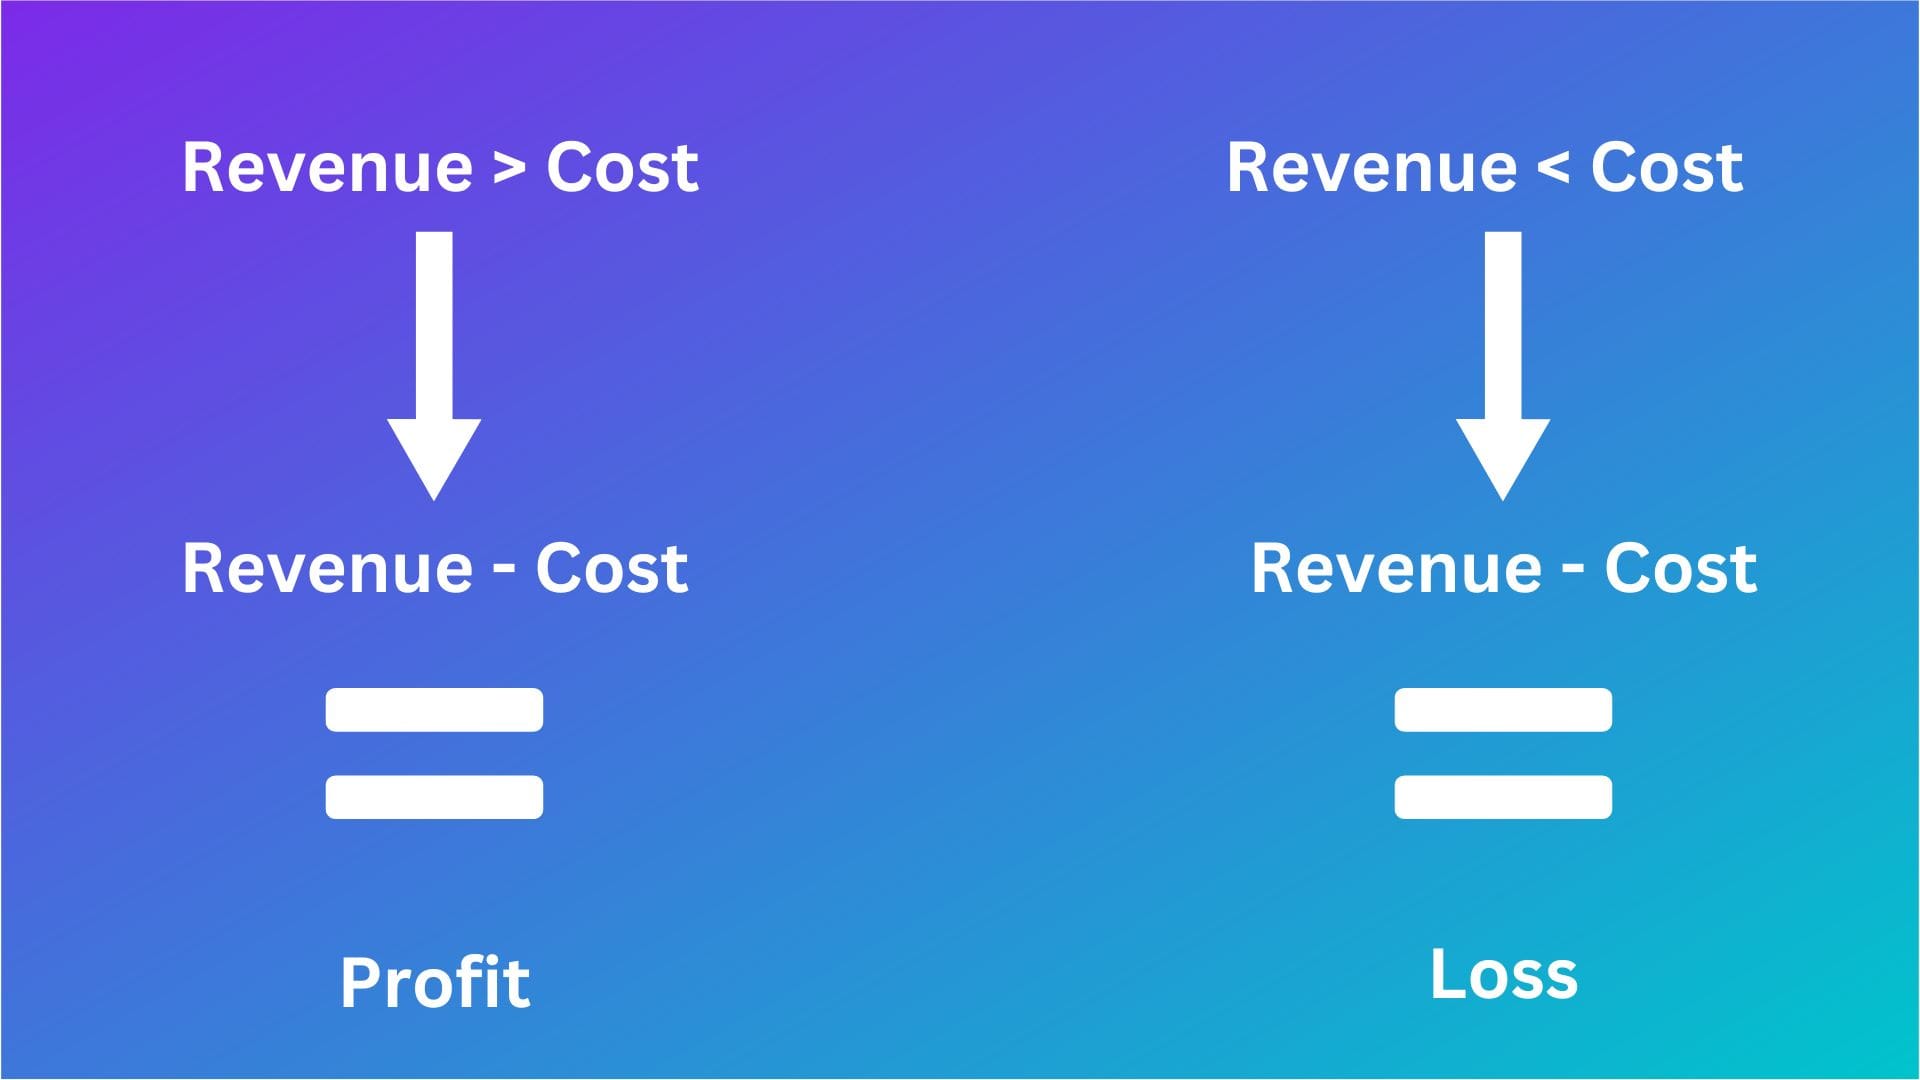
How will Jack know if he is making more money from his business than he is spending? He can check Revenue & Operating expenses. If he reduces operating expenses from his revenue, the balance is called Net Profit. So,
Revenue - Operating Expenses = Profit if Revenue > Operating Expenses
So Jack will know whether his business is earning a profit or not.
Conversely, if his Revenue is less than operating expenses, the shortfall is called Loss which means his business is running at a loss.
Operating Expenses - Revenue = Loss if Revenue < Operating Expenses
Visualizing the above
So, let us now see how Jack's business is performing :
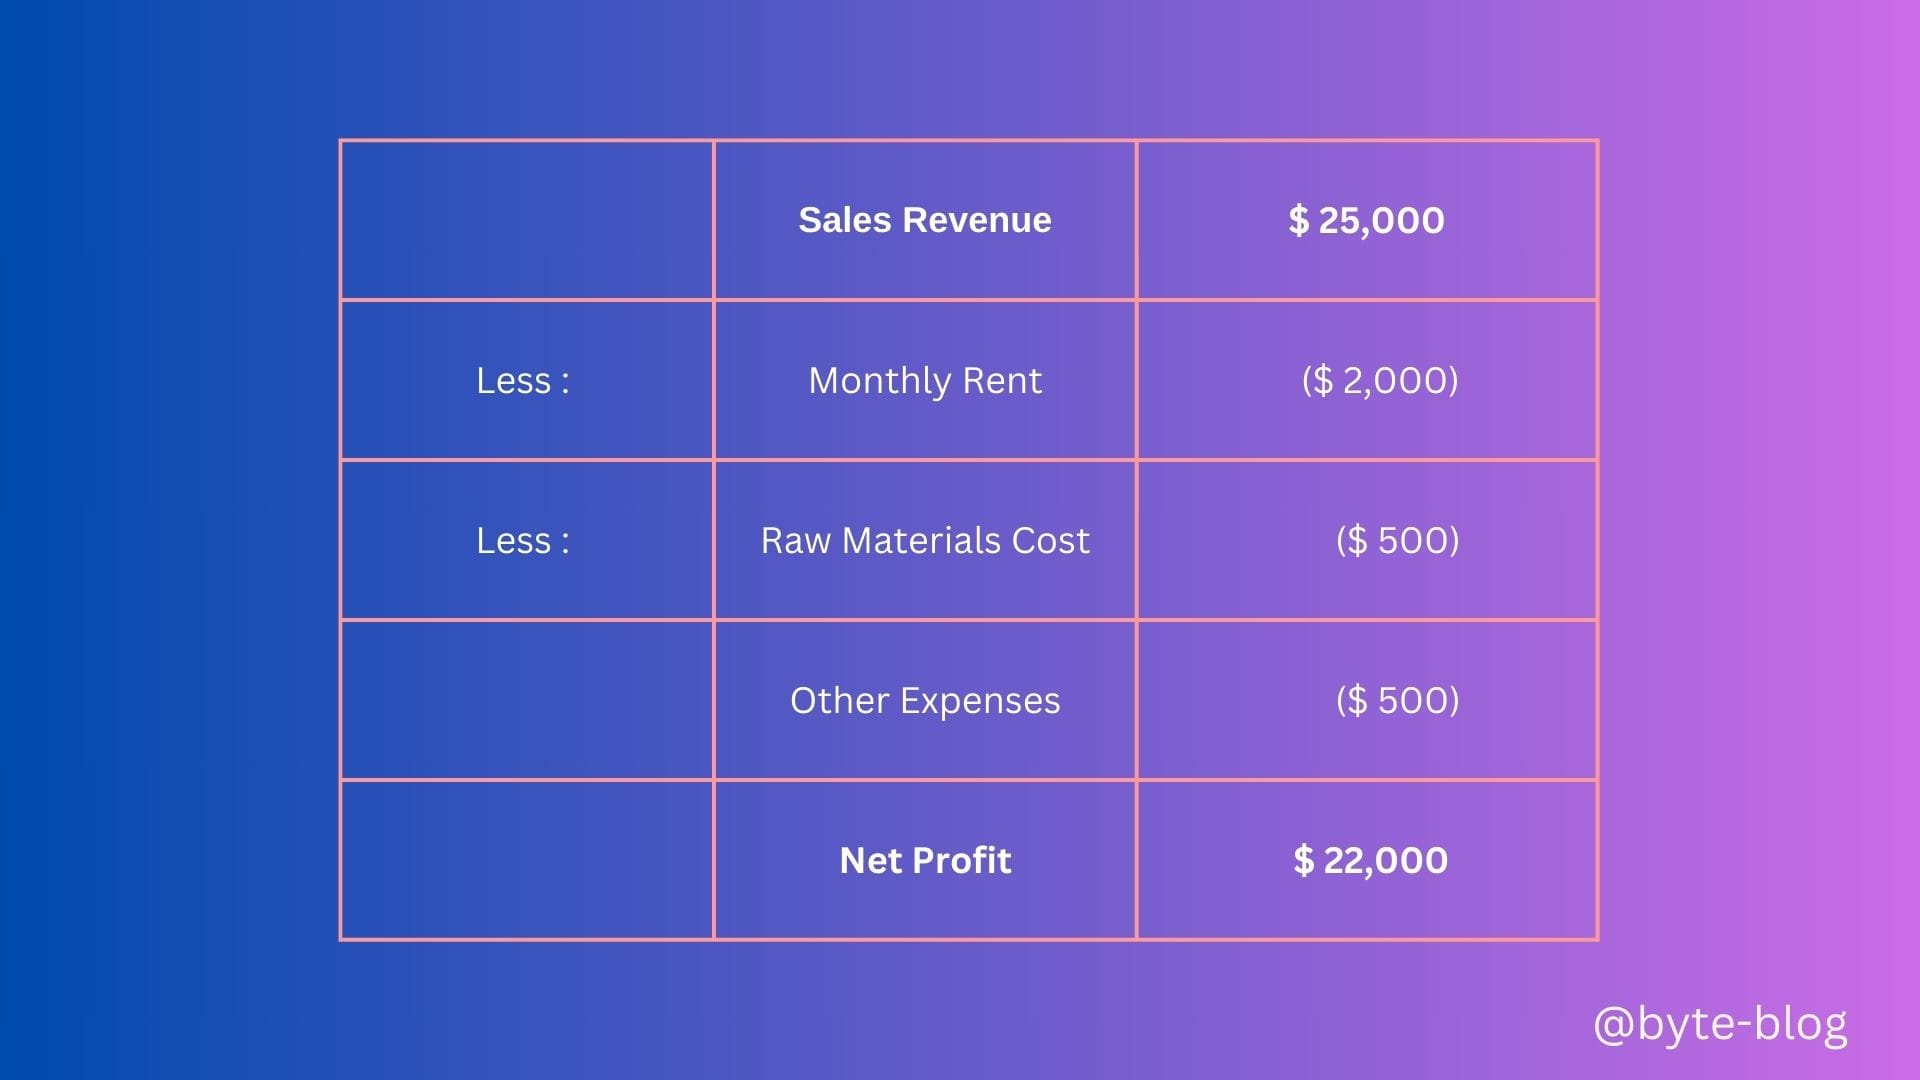
We can see that Jack is earning more than his spends which means his business earns a net profit of $ 22,000. The above statement is called an Income Statement.
An income statement is a financial report detailing a company’s income and expenses over a reporting period. It can also be referred to as a profit and loss (P&L) statement and is typically prepared quarterly or annually.
Understanding income statements is vital because they depict a company’s financial performance over a reporting period. Because the income statement details revenues and expenses, it provides a glimpse into which business activities brought in revenue and which cost the organization money—information investors can use to understand its health and executives can use to find areas for improvement.
(Source : here)
Normally, business performance is calculated for a particular period - can be a month, quarter, half year or year. It's like how much revenue is earned over expenses for that period.
So Jack will know over a period of say 3 months, 6 months or 1 year, did his business make a profit or a loss.
Since we are talking about coffee shops, let us check out the latest income statement from Starbucks from their annual report for year ended Sept 2024.
