Strategy Byte - Week 70 The Journey ends - Supply

Table of Contents
- Recap
- Supply
- Law of Supply
- Supply Determinants
- Supply Curve / Supply Schedule
- Change in Supply
- Elasticity / Inelasticity of Supply
- Market Equilibrium
Recap
Last week, we revisited the topic of Demand by defining the Law of Demand as:
Other things remaining the same, if the price of a good or service increases, it's demand falls & vice-versa
Then we explored
- Substitution Effect - when people substitute the product or service (whose price increased) with a substitute product.
- Income Effect - when income level of consumers remain the same while the price of goods / services increases. Hence, consumers will spend less resulting in lower demand.
We then discussed Demand Schedule & Demand Curve which shows the relationship between price & demand.
Next, we revisited Elasticity of Demand which measures how demand responds to a change in price or income.
We ended our discussion by linking demand to strategy. Strategy involves making the necessary choices to ensure customers prioritize a company's products or services over that of competitors & it involves understanding :
- Customer choices & preferences
- The Market & Industry dynamics
- Macro economic variables impacting customer choices
Roger L Martin in his book "Playing to Win" mentioned
The utility of a service or product to each individual will determine how much is purchased, at what price & not every consumer will have the same utility for a given product or service.
The sum total of individual demand curves = Industry Demand Curve
We will now revisit Supply - the other side of Demand which we discussed in Week 38 & Week 39.
Supply
What is Supply?

Supply is a term in economics that refers to the number of units of goods or services a supplier is willing & able to bring to the market for a specific price.
So, if a firm supplies a good or service, the firm :
- Should have the resources to produce that good or service
- Can profit from producing or supplying that good or service
- Has a definite plan to produce & sell that good or service
But producing a good or service for the sake of just supplying it doesn't make sense. To be able to produce or sell something at a particular price, there has to be DEMAND for that good or service AT A PRICE.
Thus PRICE is a key factor in determining supply of a good or service & that in turn depends on the DEMAND for that good or service.
This means both supply & demand are inter-linked & balance each other.
Law of Supply
The Law of Supply states that :
Other things remaining constant, an increase in the price of goods or services leads to an increase in the quantity supplied while a decrease in price results in decrease in the quantity supplied.
Visualizing the above :
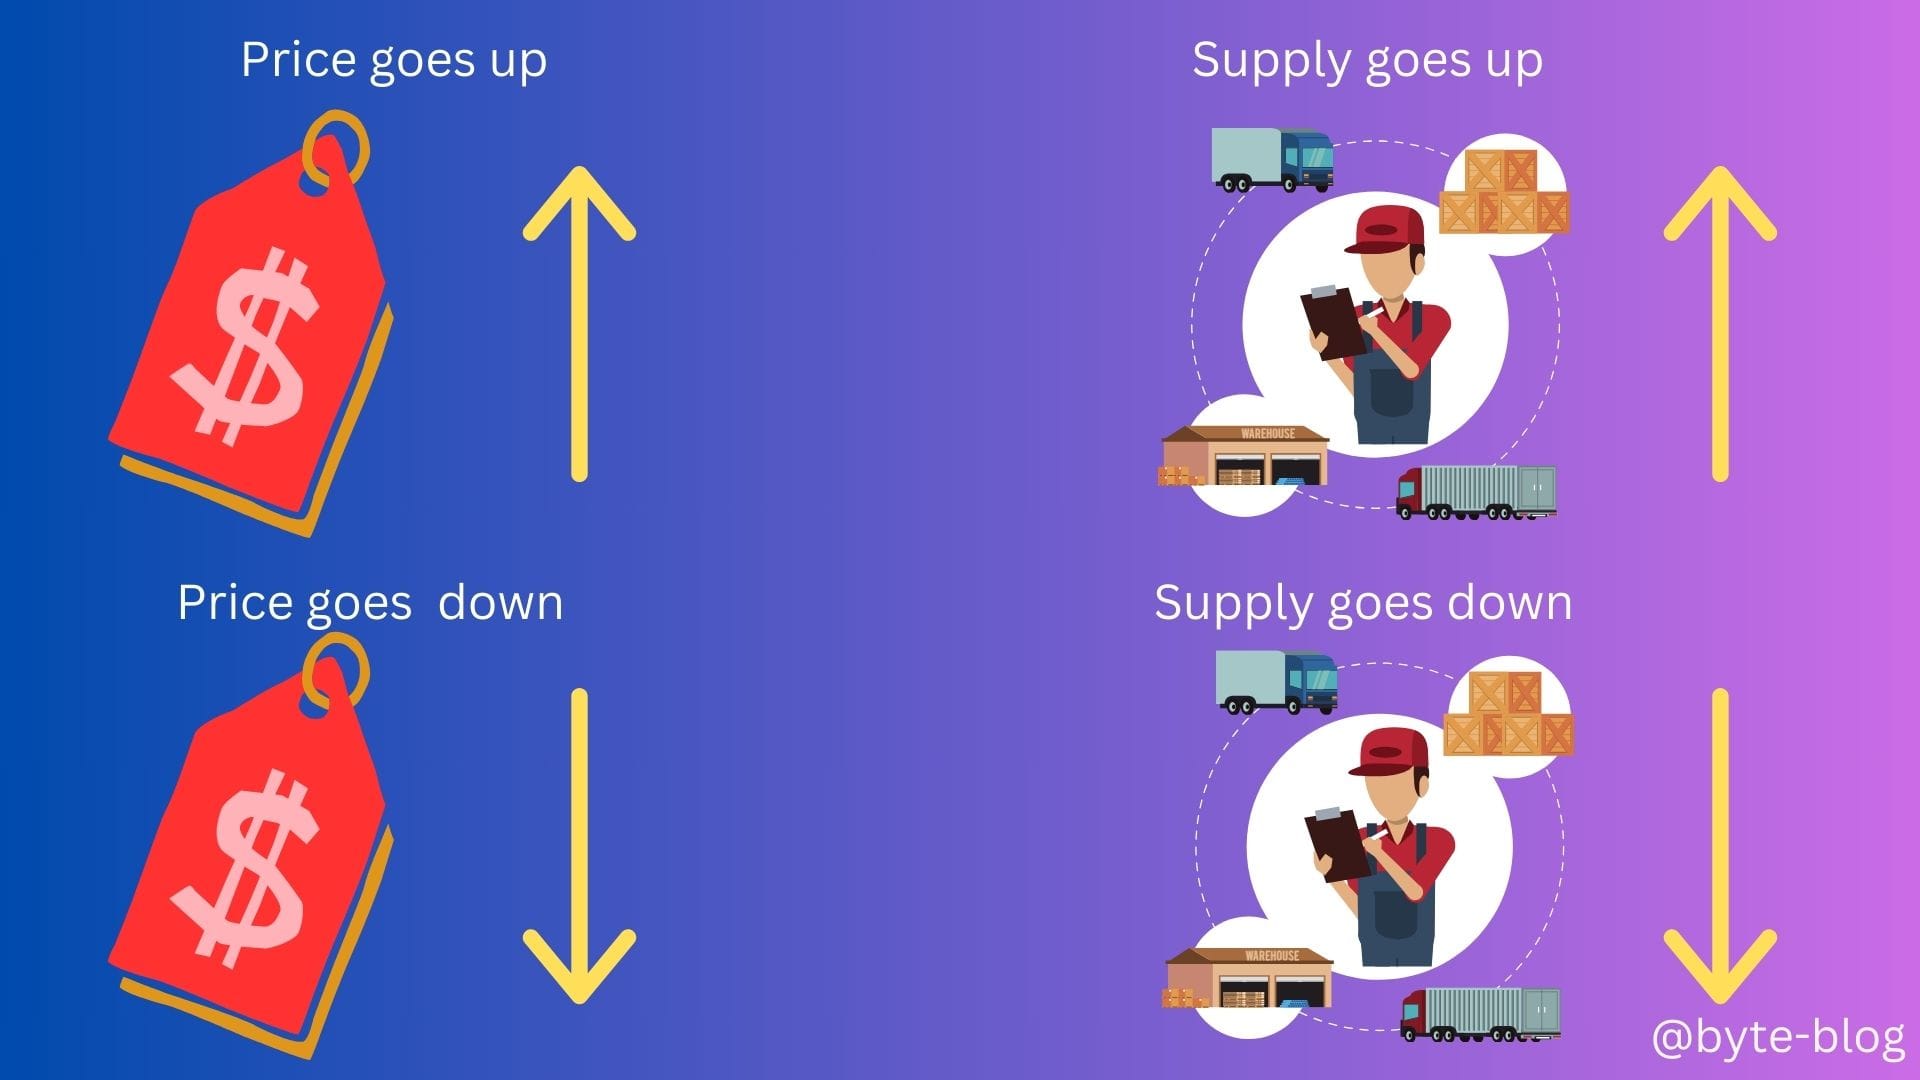
Why does this happen?
If a producer makes an additional quantity of a good, they incur additional costs for each new quantity produced.
If these goods can be sold at a higher price which covers this additional cost plus earn their margin, the producers or suppliers would definitely increase production. The additional cost of producing one additional good is called Marginal Cost of producing that good.
If prices of goods fall down, producing additional goods will only increase their marginal cost of production bringing down their margin & increasing losses. Hence, decreasing supply helps in reducing losses.
Price is only one determinant of supply. What are the others?
Supply Determinants
In reality, there are multiple factors impacting supply of goods or services. They are :
- Cost of Production
- Prices of related goods
- Expected future prices
- No. of suppliers
- Technology & Innovation
We will elaborate each point in a bit. But now that we understand supply & it's determinants, let us explore the relationship between Price & Supply just like we did with Demand. This relationship is represented by a Supply Curve or a Supply Schedule.
Supply Curve / Supply Schedule
At it's core, the supply schedule is a tabular representation of the relationship between the price of a good or service & the quantity producers are willing & able to supply to the market, all things remaining equal.
Visualizing a Supply Schedule :
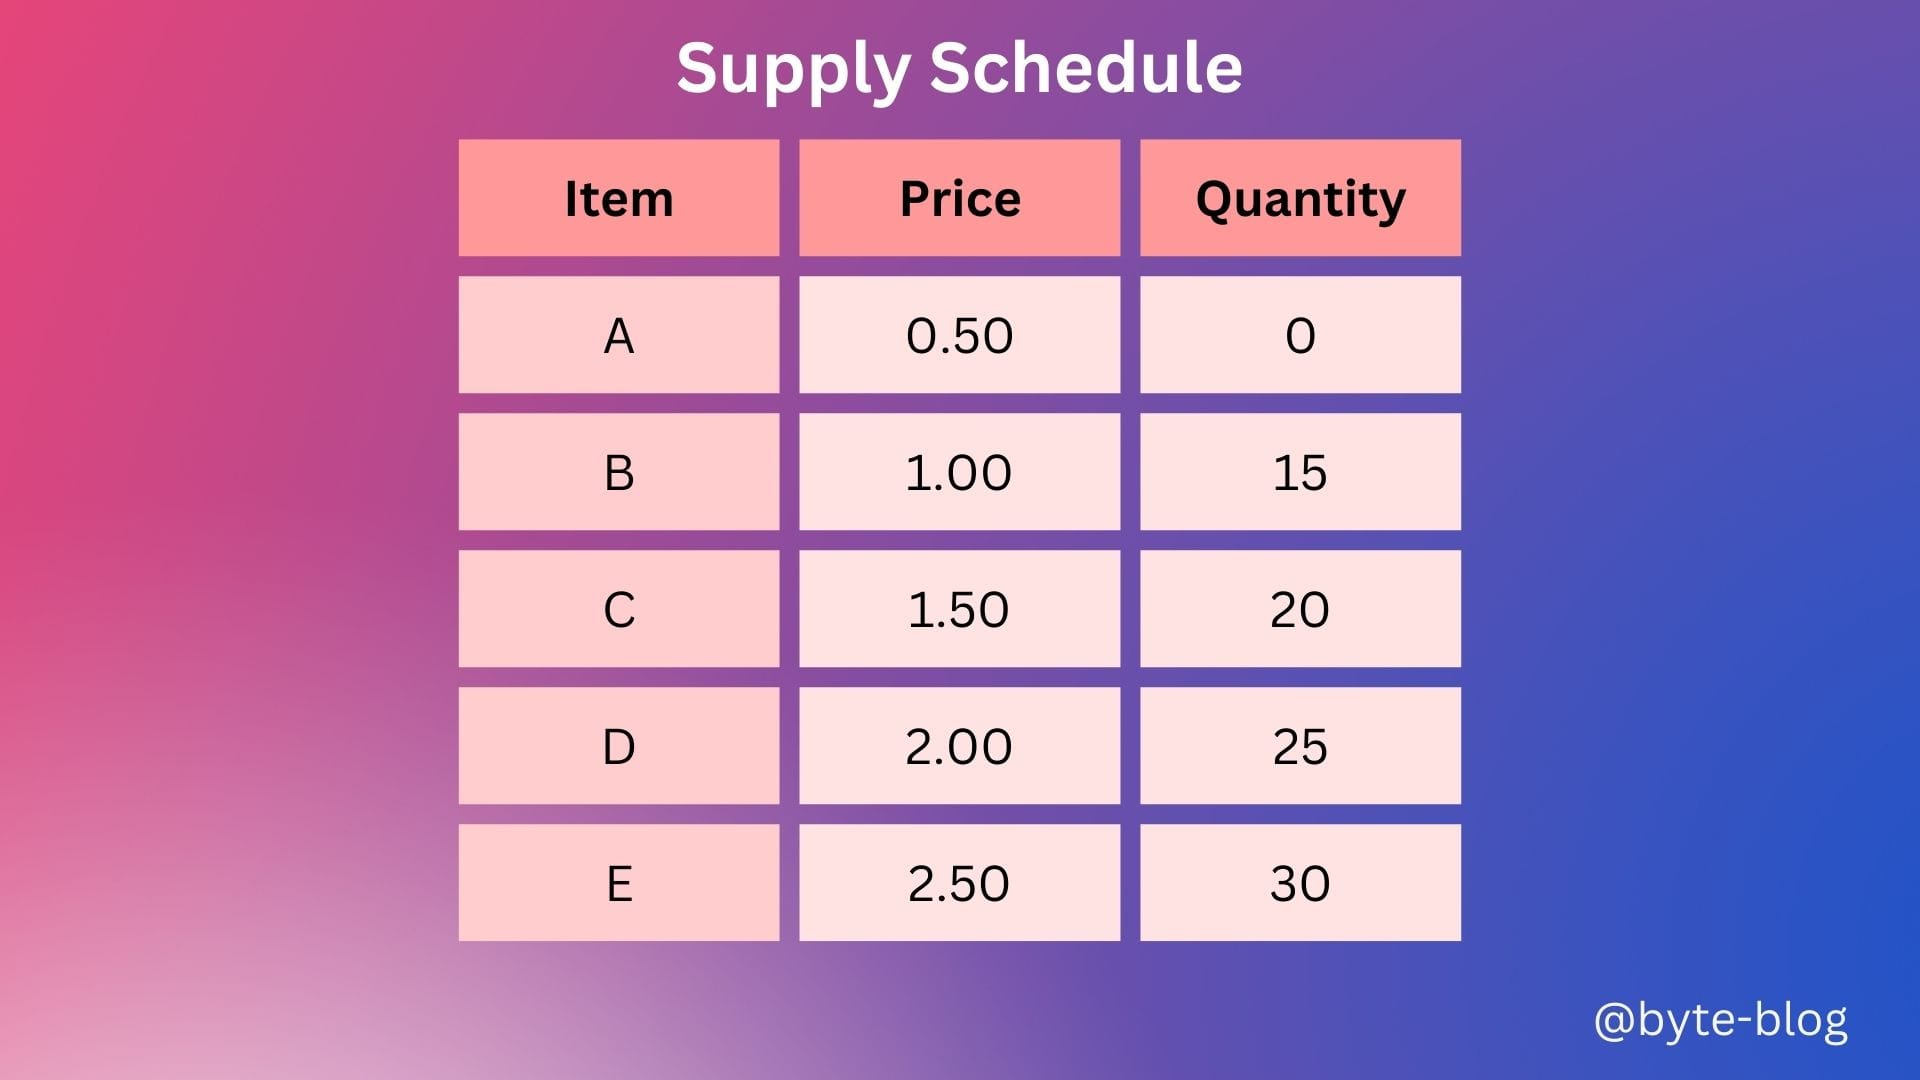
The Supply Curve is a graph of a supply schedule which shows the quantity supplied on the X-axis & the price on the Y-axis. (Recollect that for the Demand Curve, the price is on the X-axis & the quantity on the Y-Axis).
A Supply Curve for the above supply schedule will look like :
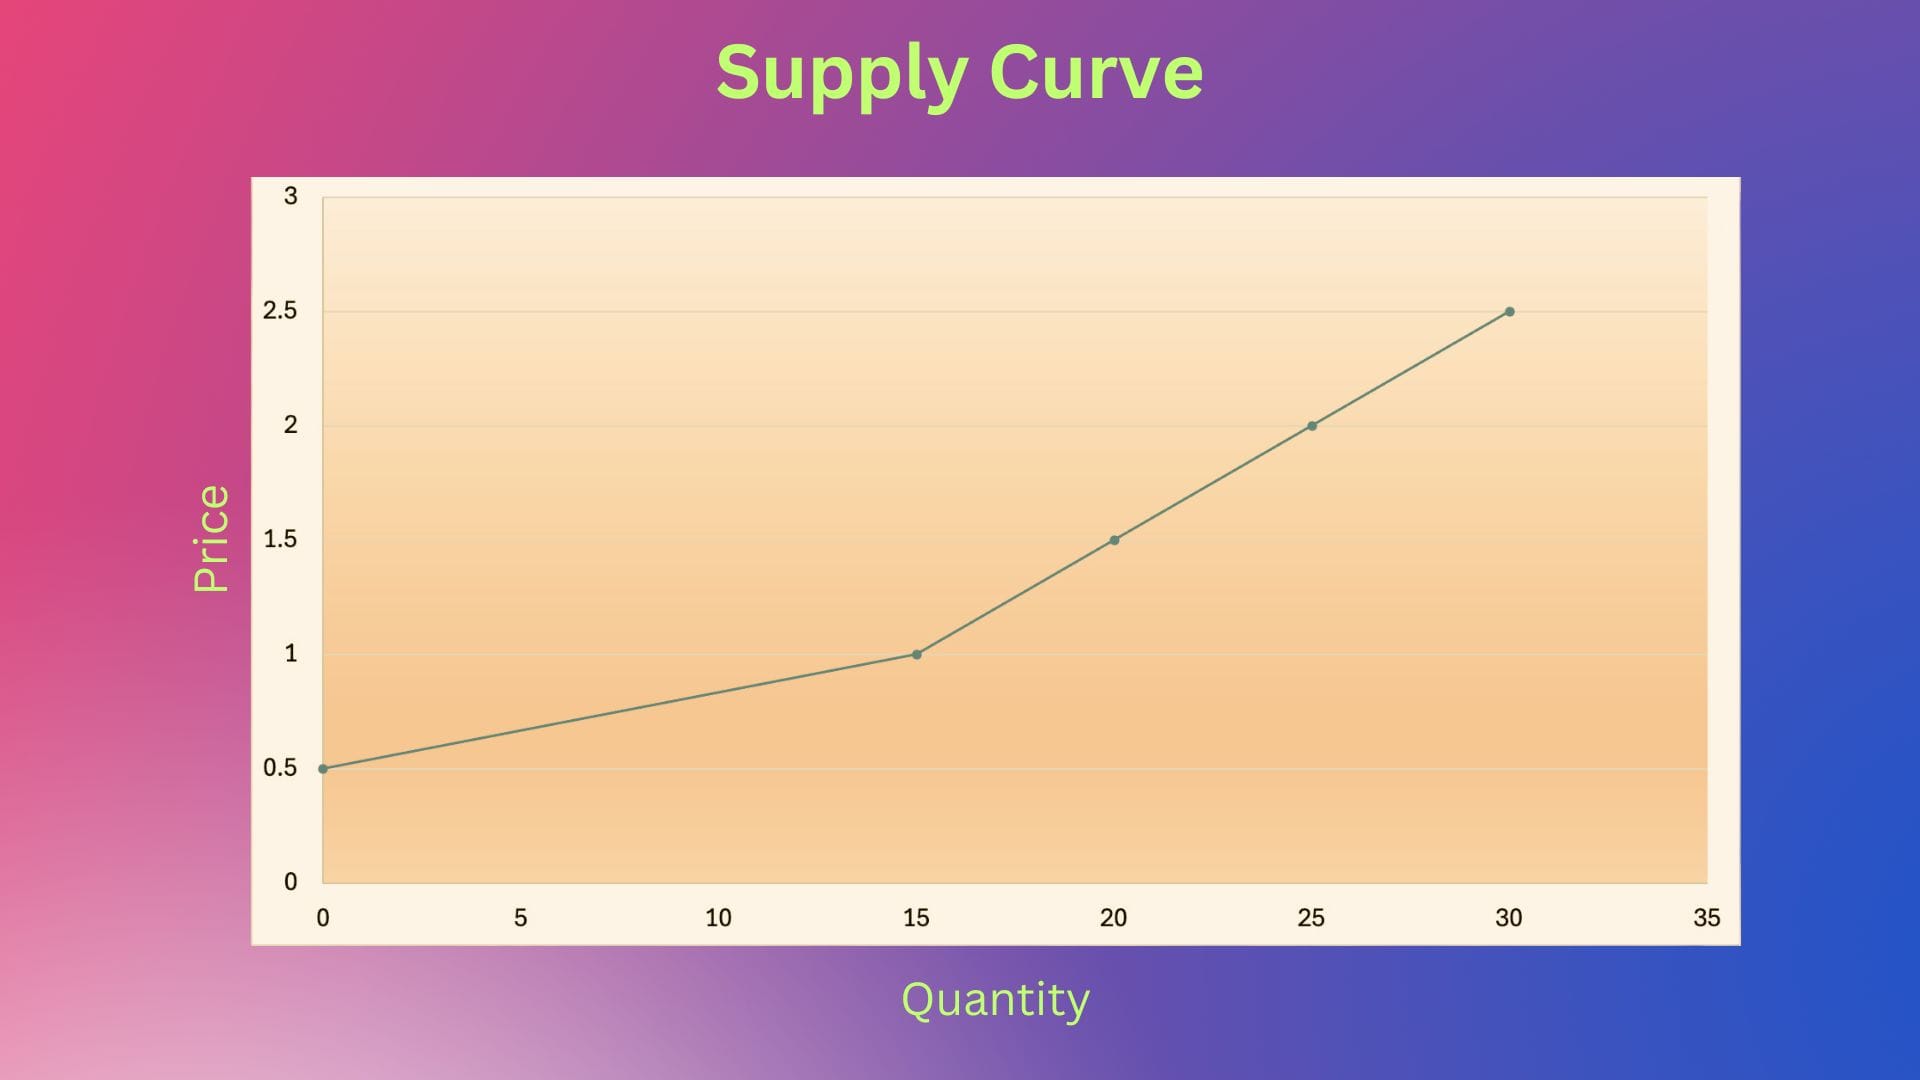
In this case, the supply curve slopes upward from left to right, indicating that as the price of a good increases, producers are willing to supply more of it.
Let us now bring in the determinants (discussed above) other than price & gauge it's impact on supply.
Change in Supply
When any factor other than price influences supply, it causes change in supply. Going more deeper into the supply determinants :
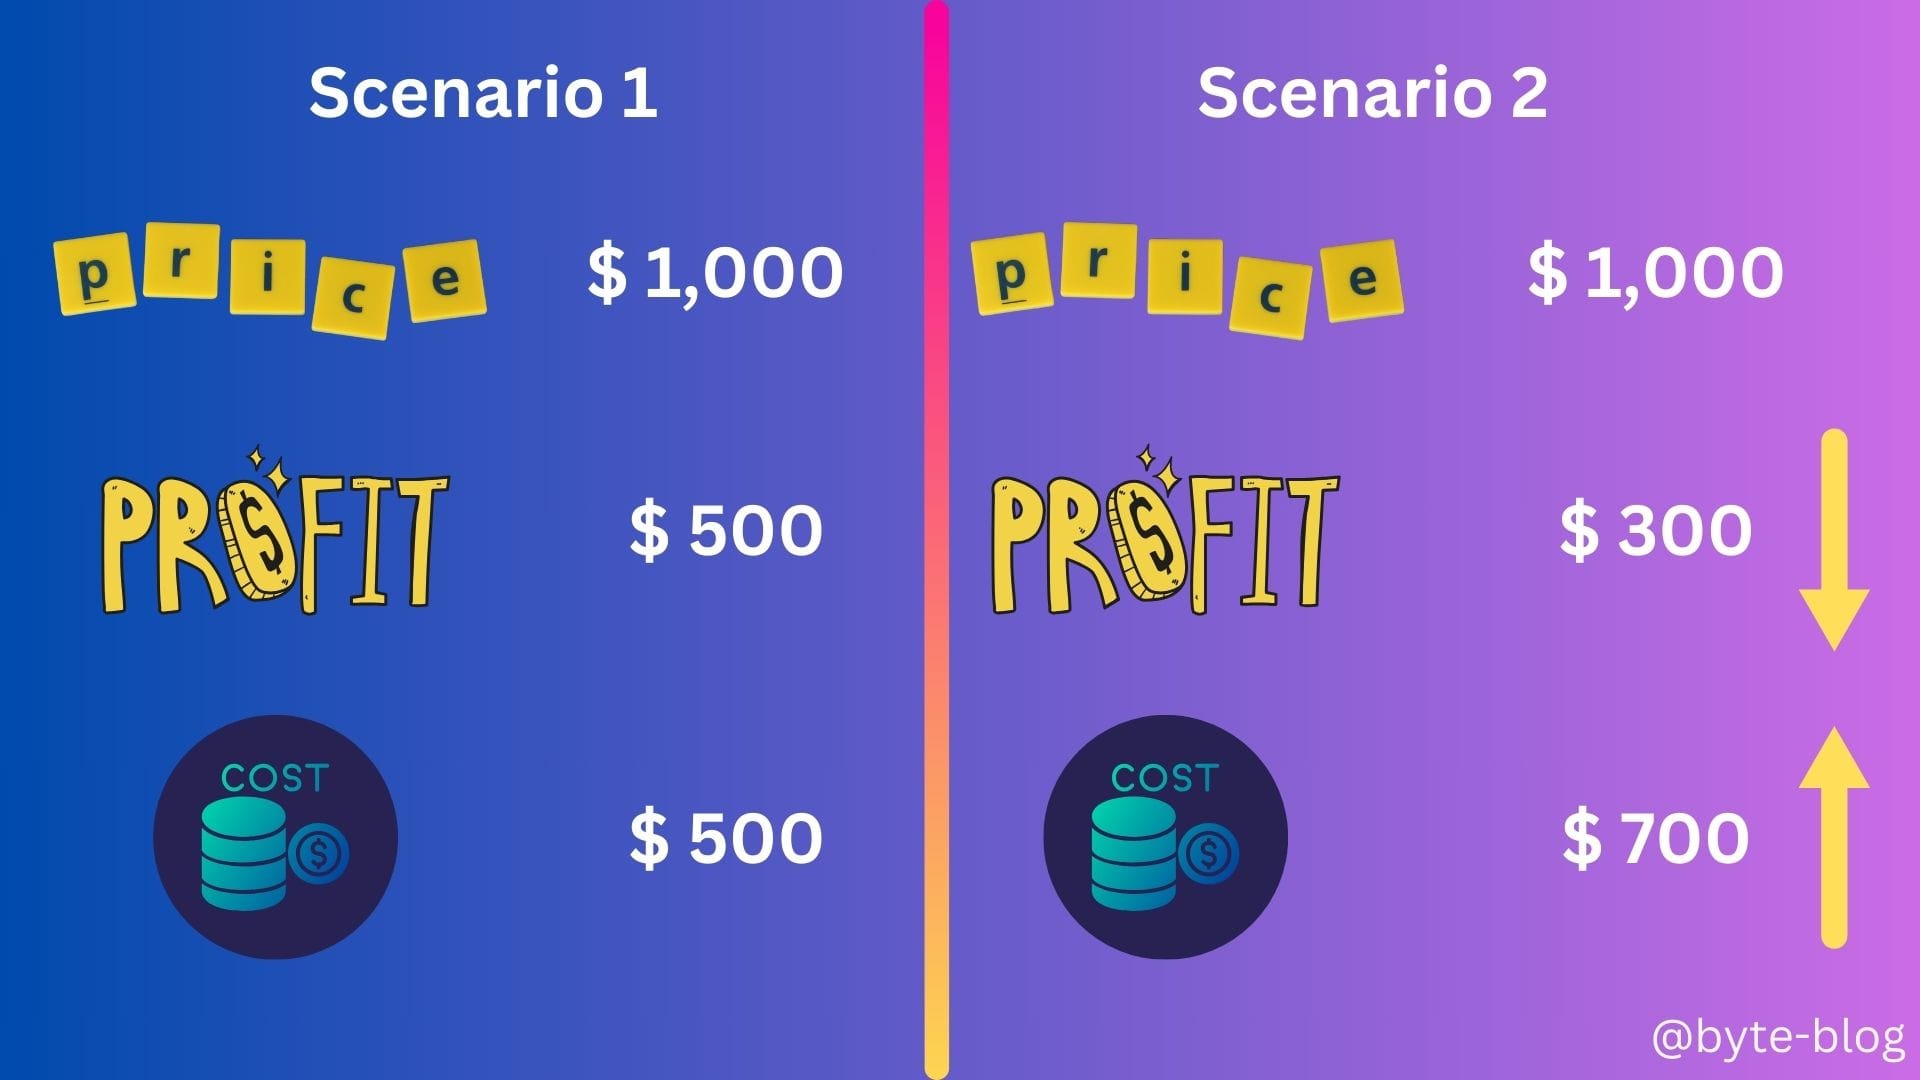
- Cost of Production - When the cost of production of a good or service rises, a firm decreases their production or supply to reduce losses.
- Price of related goods - The prices of related products can impact the price of main product either positively or negatively depending on it's relationship to the main product.
- Expected future prices - Firms plan their production or supply depending on the expected future prices at which they will be sold. If future prices are expected to be high, firms will delay production to ensure goods are produced & sold at higher prices
- No. of suppliers - More suppliers of a particular good or service results in higher supply of that good or service & vice versa.
- Technology & Innovation - Technology & innovation advances can lead to efficiency &/or improved production processes which impacts supply.
The above scenarios will result in the supply curve moving right or left depending on whether the above factors cause an increase or decrease in supply respectively.
Visualizing the above :
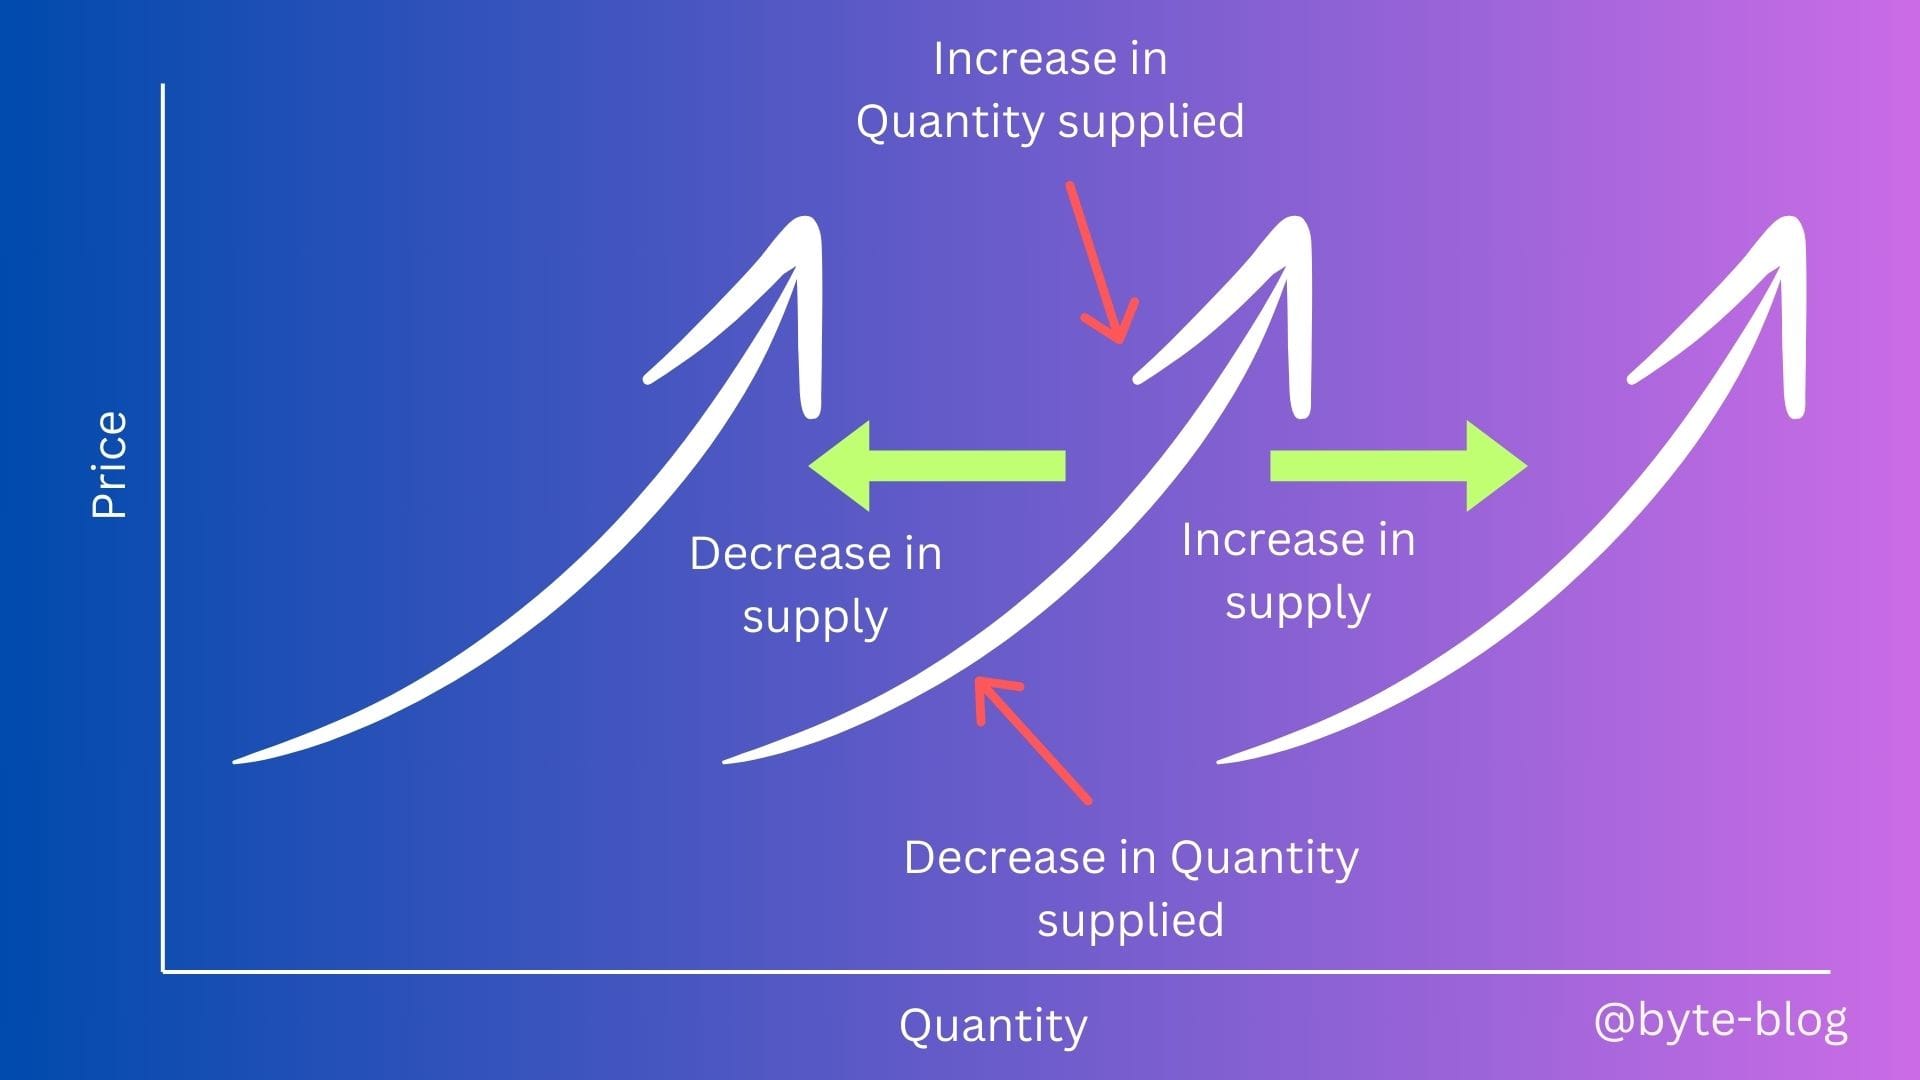
When the price of a good or service changes, the movement takes place along the supply curve & a change in the quantity supplied shown by the red arrows on the supply curve.
When any other factors other than price changes, there is a shift in the supply curve & a change in supply as shown by the shift rightward if the supply increases & leftward if the supply decreases.
Now that we know changes in supply can arise due to price &/or other factors. But by how much does the supply change? Is there a substantial change in supply or is it negligible?
Elasticity / Inelasticity of Supply
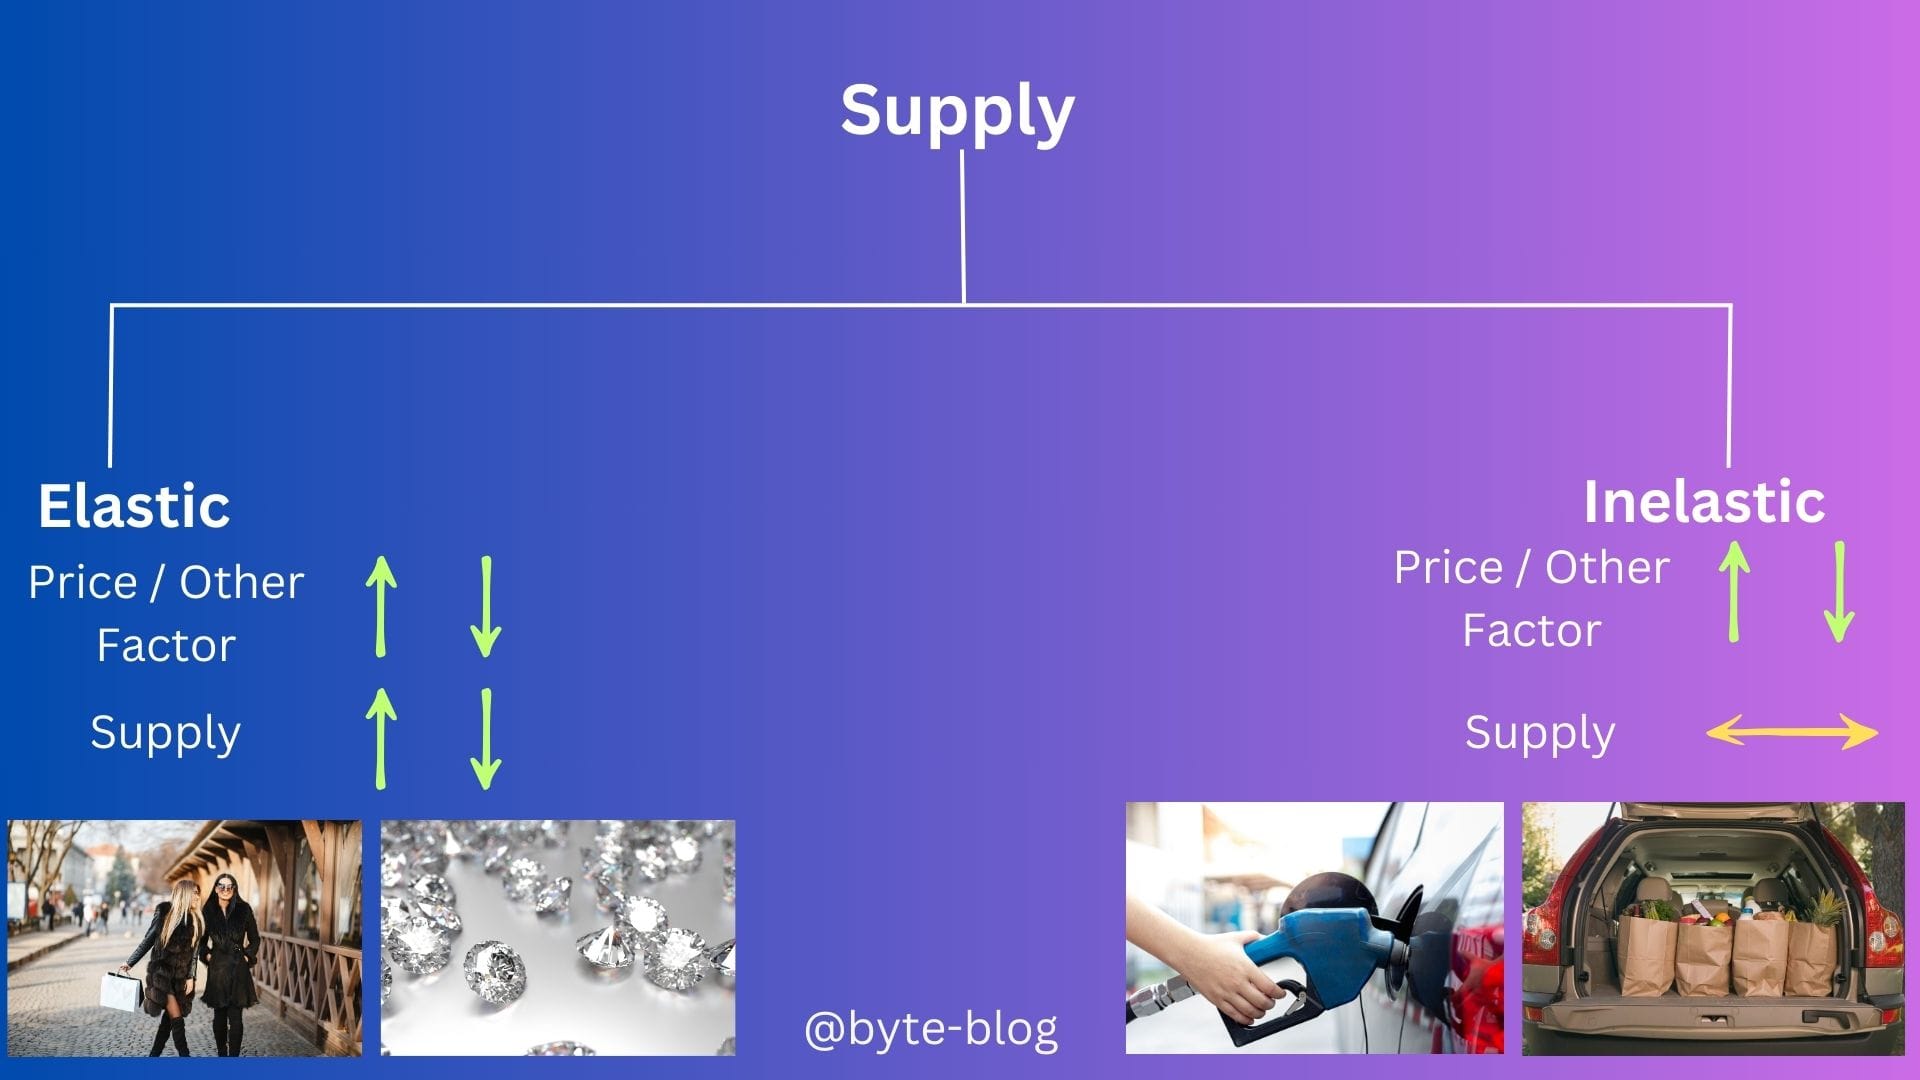
Elasticity of supply is a measure of the degree of change in the quantity supplied of a product in response to a change in its price
When a change in price or other factors leads to a significant change in supply, such goods are referred to as Elastic Goods. E.g., In a growing economy where income levels rise, demand for certain products rise & hence suppliers can increase supply & price in line with demand.
But in a recessionary environment, consumers tend to spend less & discretionary spending is the first to be chopped off the spending list leading to reduced demand for such goods or services. This causes prices to fall resulting in producers reducing production & supply.
Where a change in price or other factors does not lead to a significant change in supply, such goods are referred to as Inelastic Goods. E.g., irrespective of whether the economy is booming or in recession, there are certain necessities which consumers will buy whatever the price is like gasoline, groceries etc where the production or supply cannot be reduced.
The below visualization summarizes the above :
We end this flashback with one last concept - Market Equilibrium
Market Equilibrium
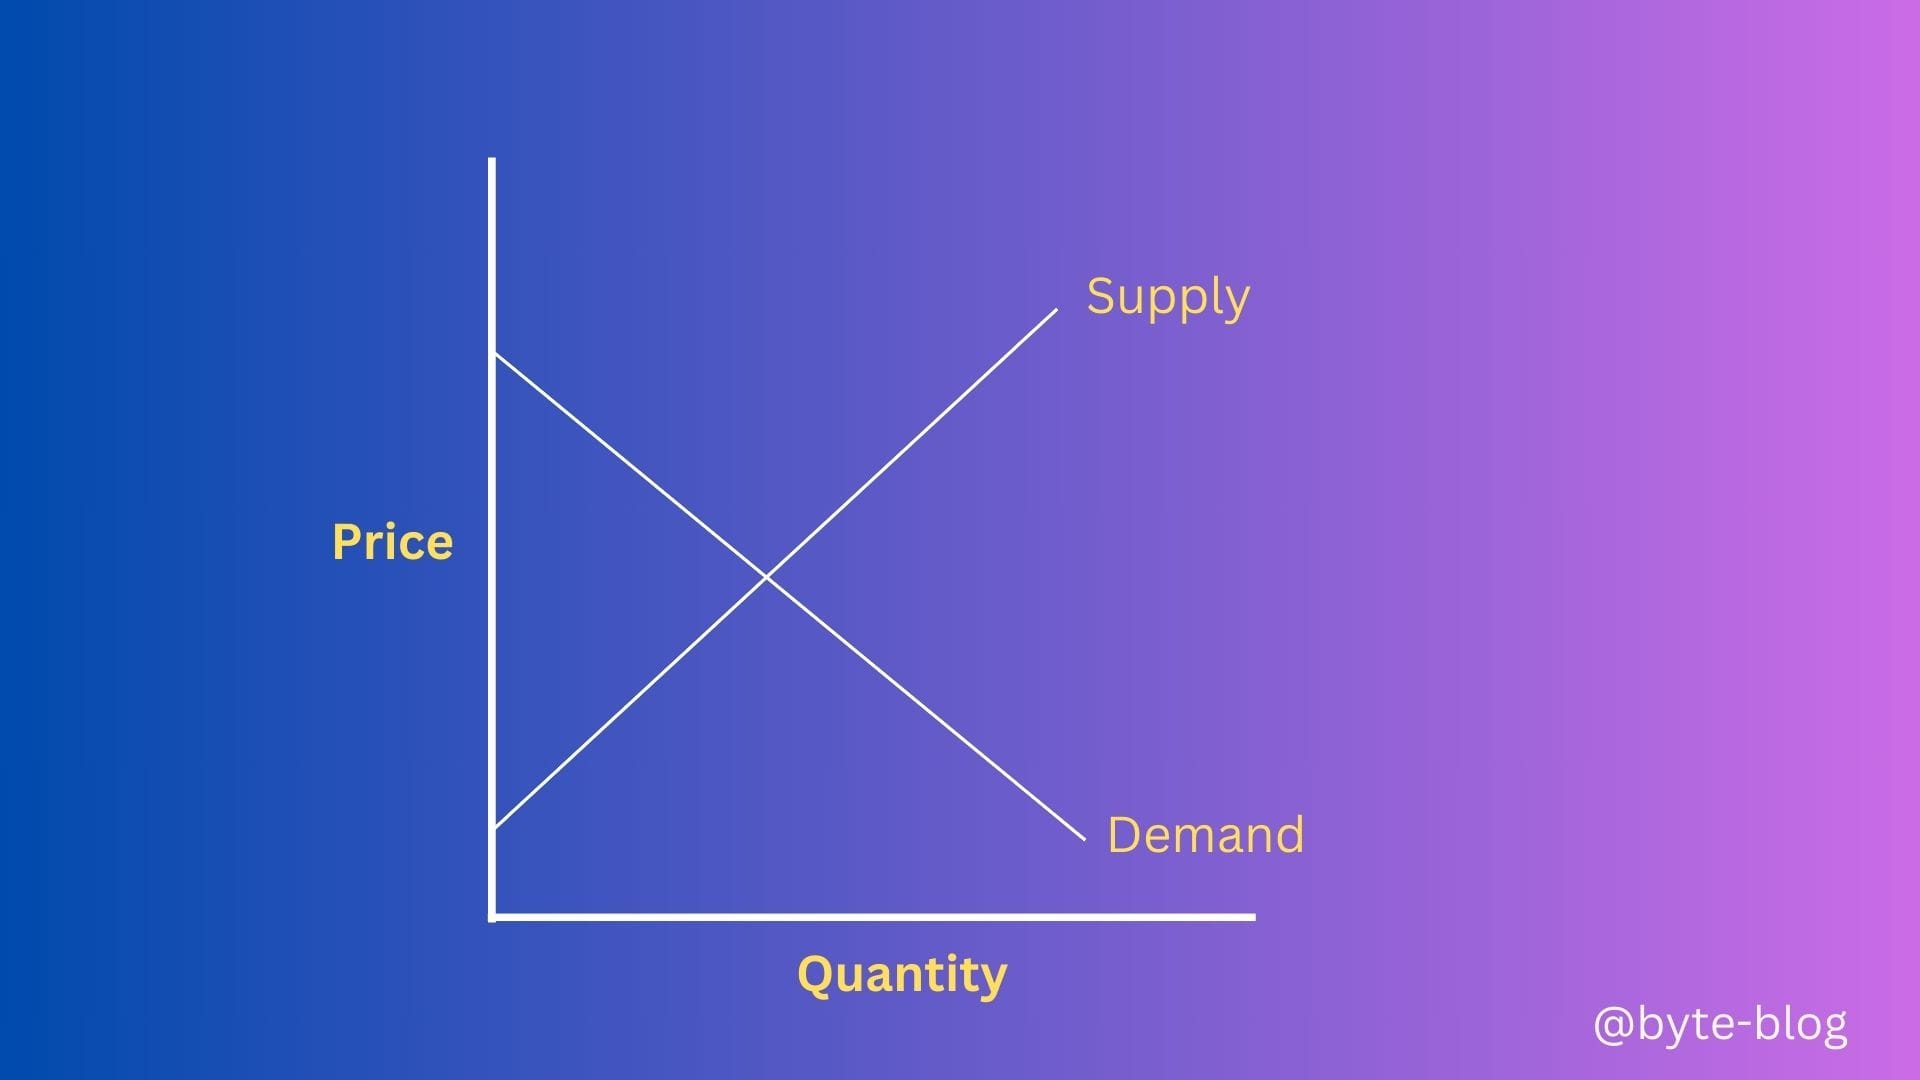
In the context of supply & demand, we saw that price changes supply & demand in the opposite direction. Revisiting the demand & supply curves :
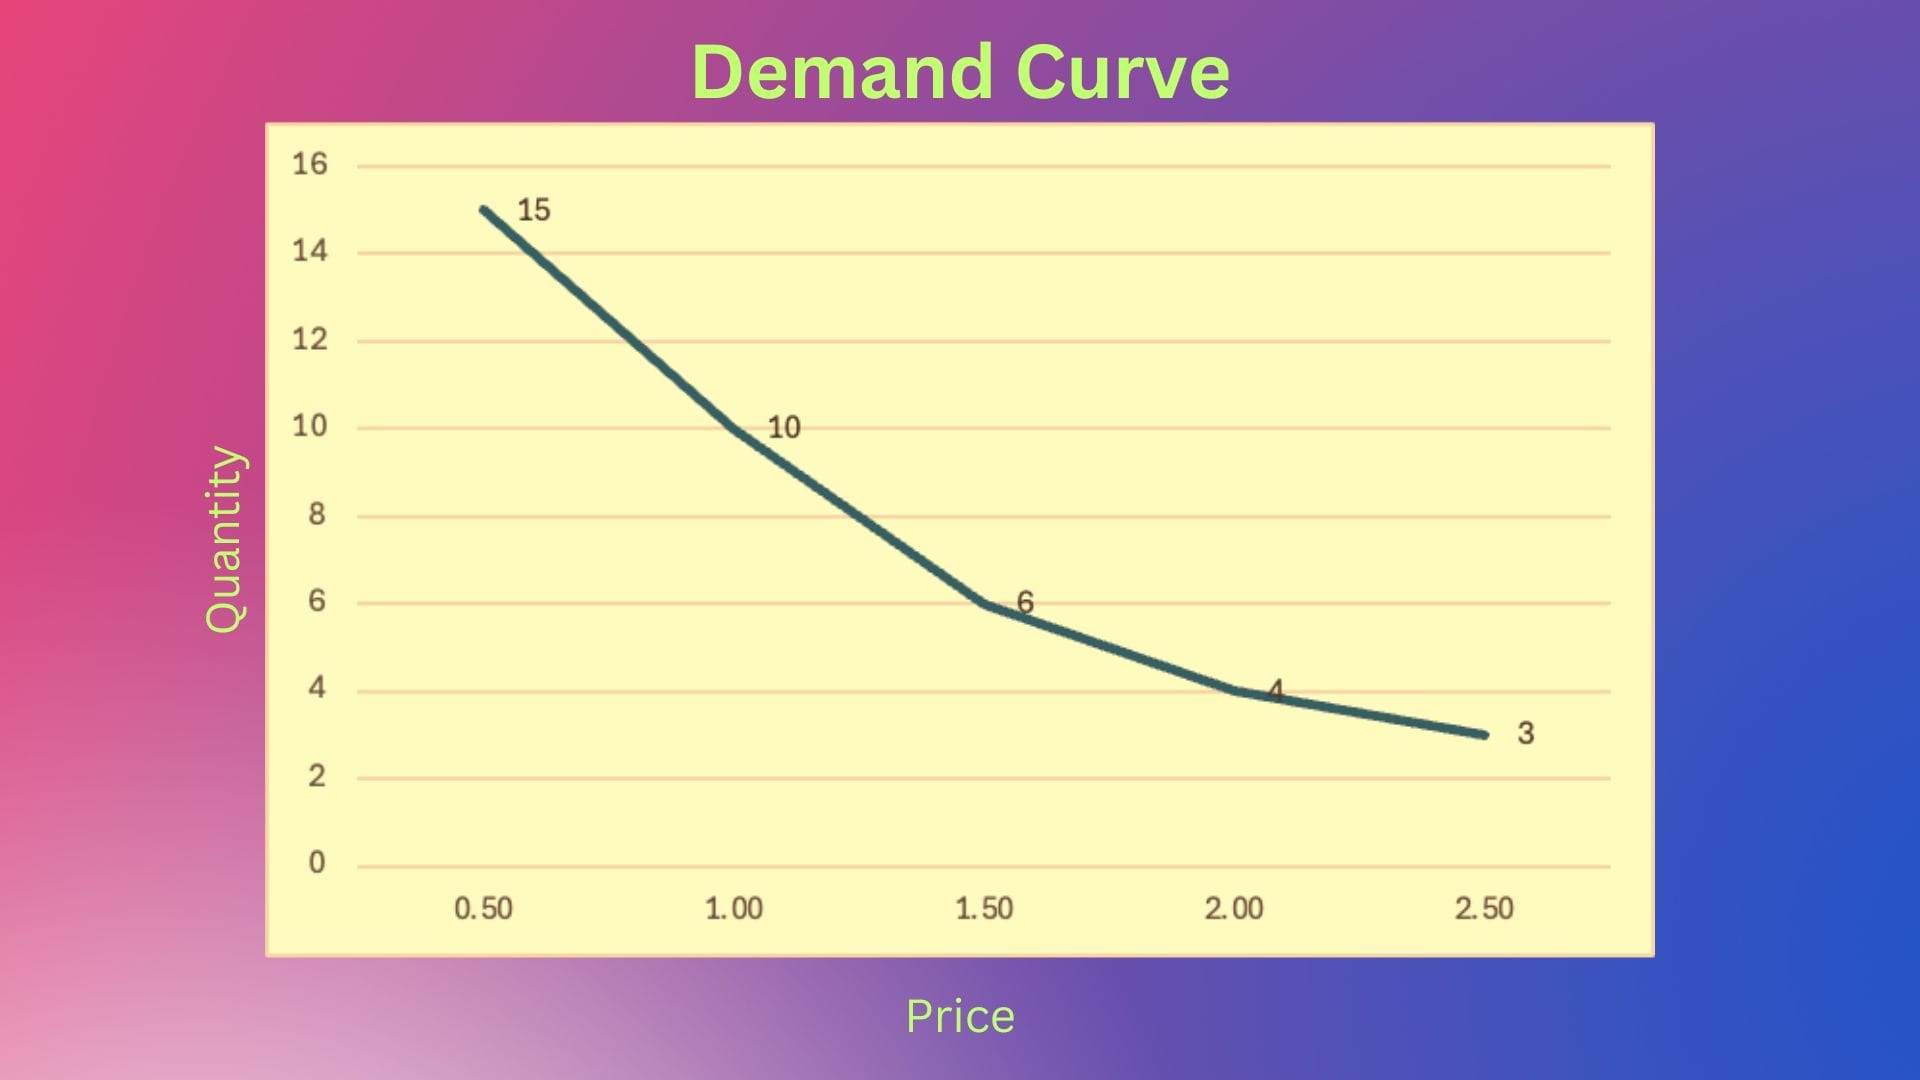

So,
- Based on the demand curve, if price increases, quantity demanded decreases & vice versa
- Based on the supply curve, if price increases, quantity supplied increases & vice versa
So price changes impact supply & demand differently & in opposite directions. Thus, these are opposing forces. Putting both the above curves in one graph as below :
The point where the supply & demand curves meet (where supply = demand) is called the Market Equilibrium.
Let us plot the market equilibrium point in the X-axis (Q1) & Y-axis (P1).
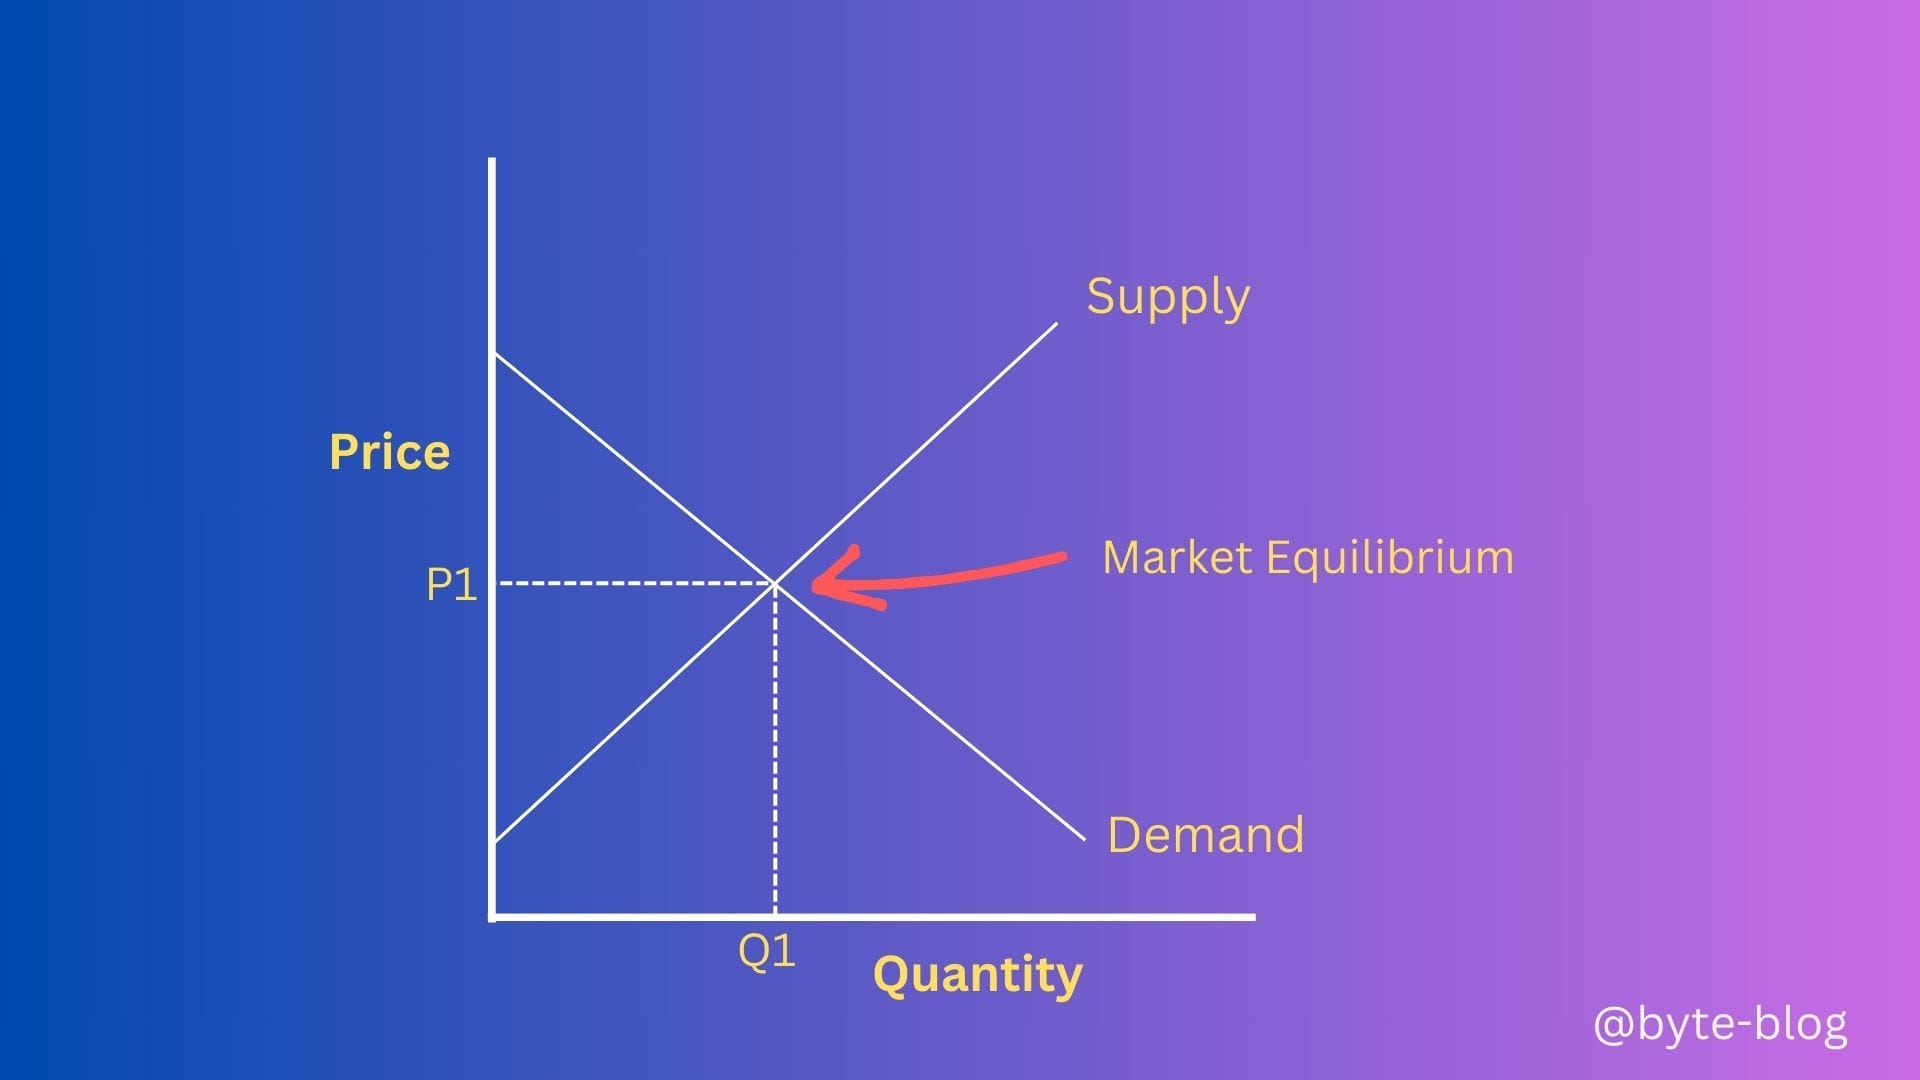
In the diagram above, Q1 is the quantity & P1 is the price where supply = demand. When a market is in equilibrium, prices do not generally tend to change.
But in real life, demand does not equal to supply causing disequilibrium which causes firms to change prices in line with actual supply & demand. Market equilibrium is more of a dynamic state depending on the supply & demand. Understanding this helps to analyze how prices can fluctuate in line with either variation in supply or demand.