Strategy Byte - Week 82 Profit Pools Part II

Table of Contents
- Recap
- Visualizing Value Chain
- Constructing Industry Map
- Understand Economic Interactions
- Distribution of Economic Profits
- Mapping the Future
Recap
During Week 81, we explored profit pools in depth. Just like a natural pool creation starts with a drop of water, a profit pool is created with value creation. Value capture is possible only if there is value creation.
How is value creation converted to value capture? - through proper pricing.
We explained through a cafe business how each player in the coffee industry captures value. Reproducing the visual below :
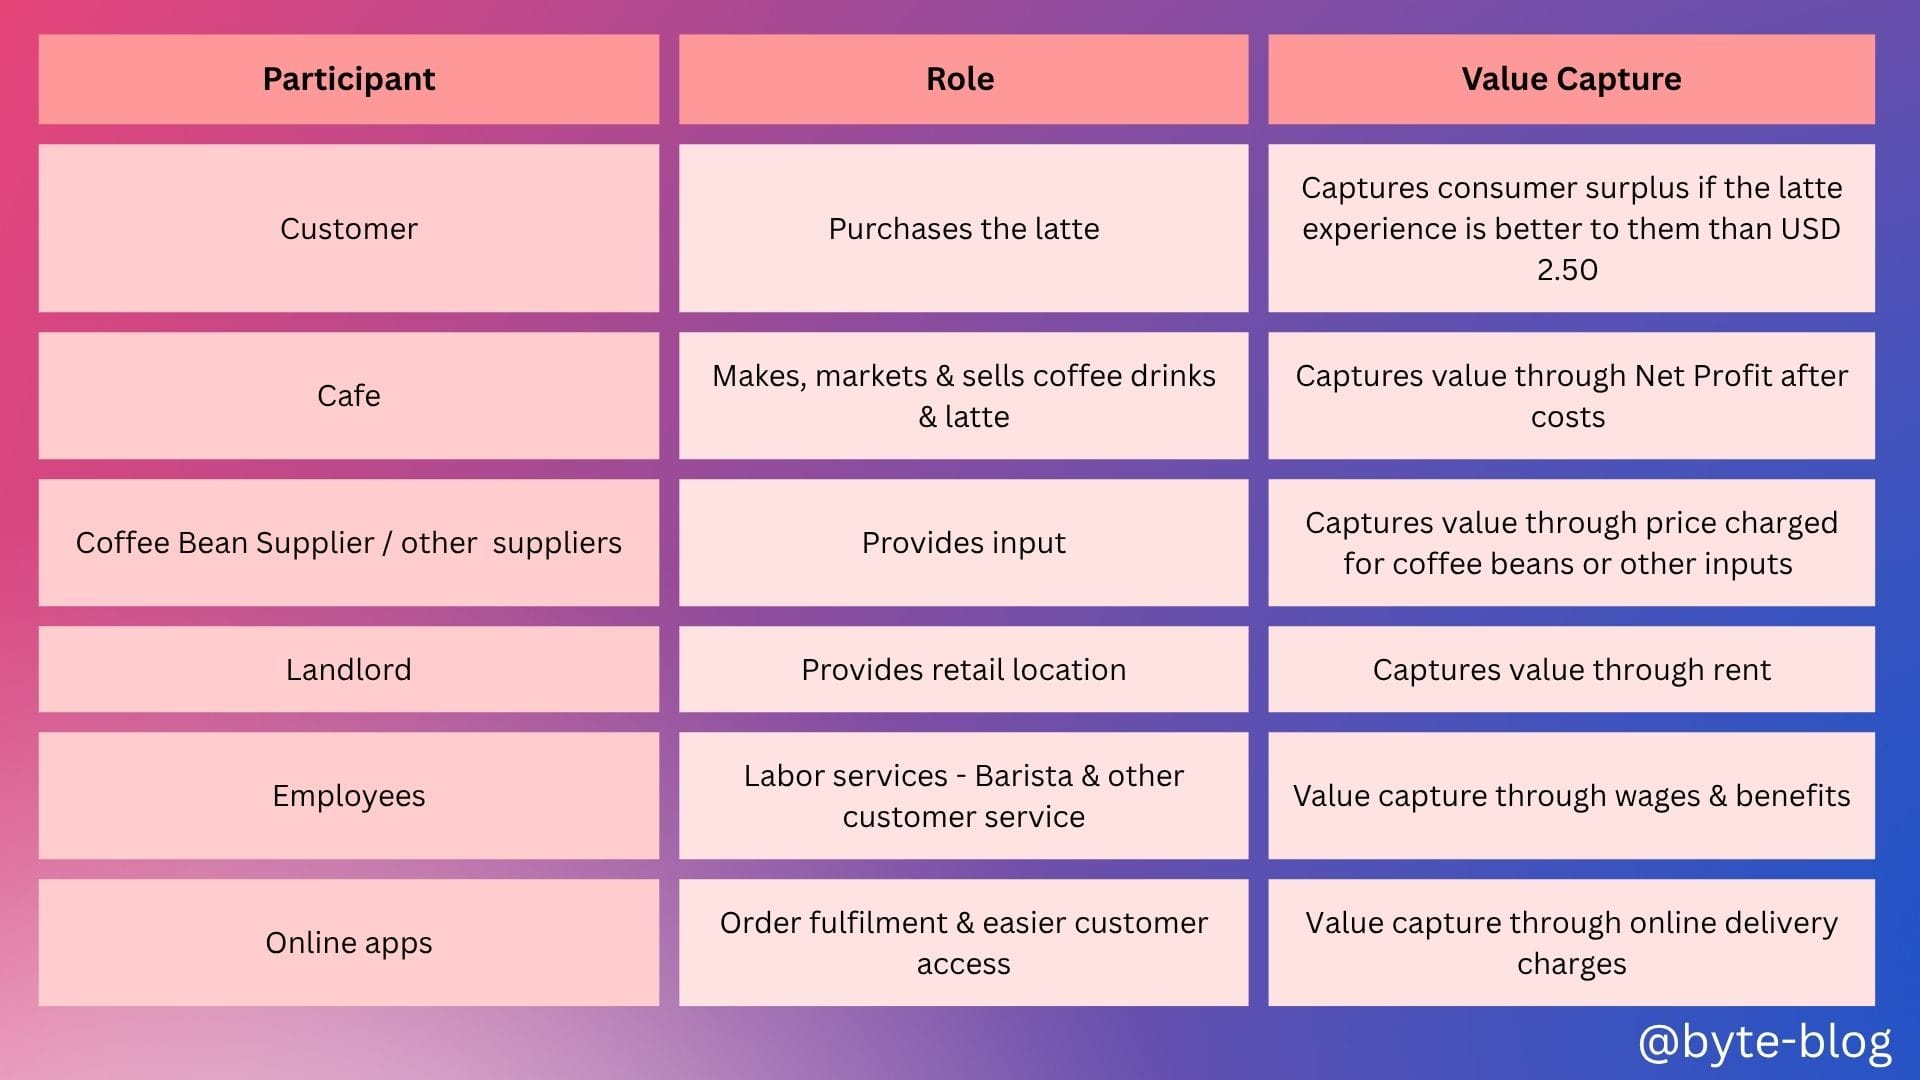
Then we correlated Five Forces with value capture by each player as follows:
- Rivalry among firms - Higher competition usually lowers industry profitability
- Buyer Power - Buyer Power can reduce margins by forcing prices down &/or raising the cost of service
- Supplier Power - Supplier power can reduce firm margins unless input cost increases are passed on to customers
- Threat of new entrants - New entry increases supply & intensifies rivalry
- Threat of Substitutes - Substitutes provide more options to customers reducing firm leverage.
We concluded that the interplay of Five forces between industry participants impact value capture by each of them.
But how does one visualize a profit pool? Who looks at it anyway? How is it helpful?
Before getting to the answers, it is important to first understand the underlying activities leading to value capture. Then how that value capture is translated to profit pools. Onwards to visualization

Visualizing Value Chain
We can visualize & divide the activities in an an industry activities into :
- Input Activities - related to procuring inputs, supplier relations etc (Inbound Logistics)
- Transformation Activities - Transforming inputs to outputs or finished products taking place within the firm or enterprise (Operations)
- Output Activities - Moving the outputs or finished products to customers (Outbound Logistics, Marketing & Sales, Service)
All the activities in total (also called Primary Activities) add value by transforming raw inputs to finished output.
The above is what Michael Porter called "Value Chain". We discussed this earlier, so visualizing the value chain as described by him.
In addition to the above three, there are also support functions (Support Activities) which help move the primary activities.
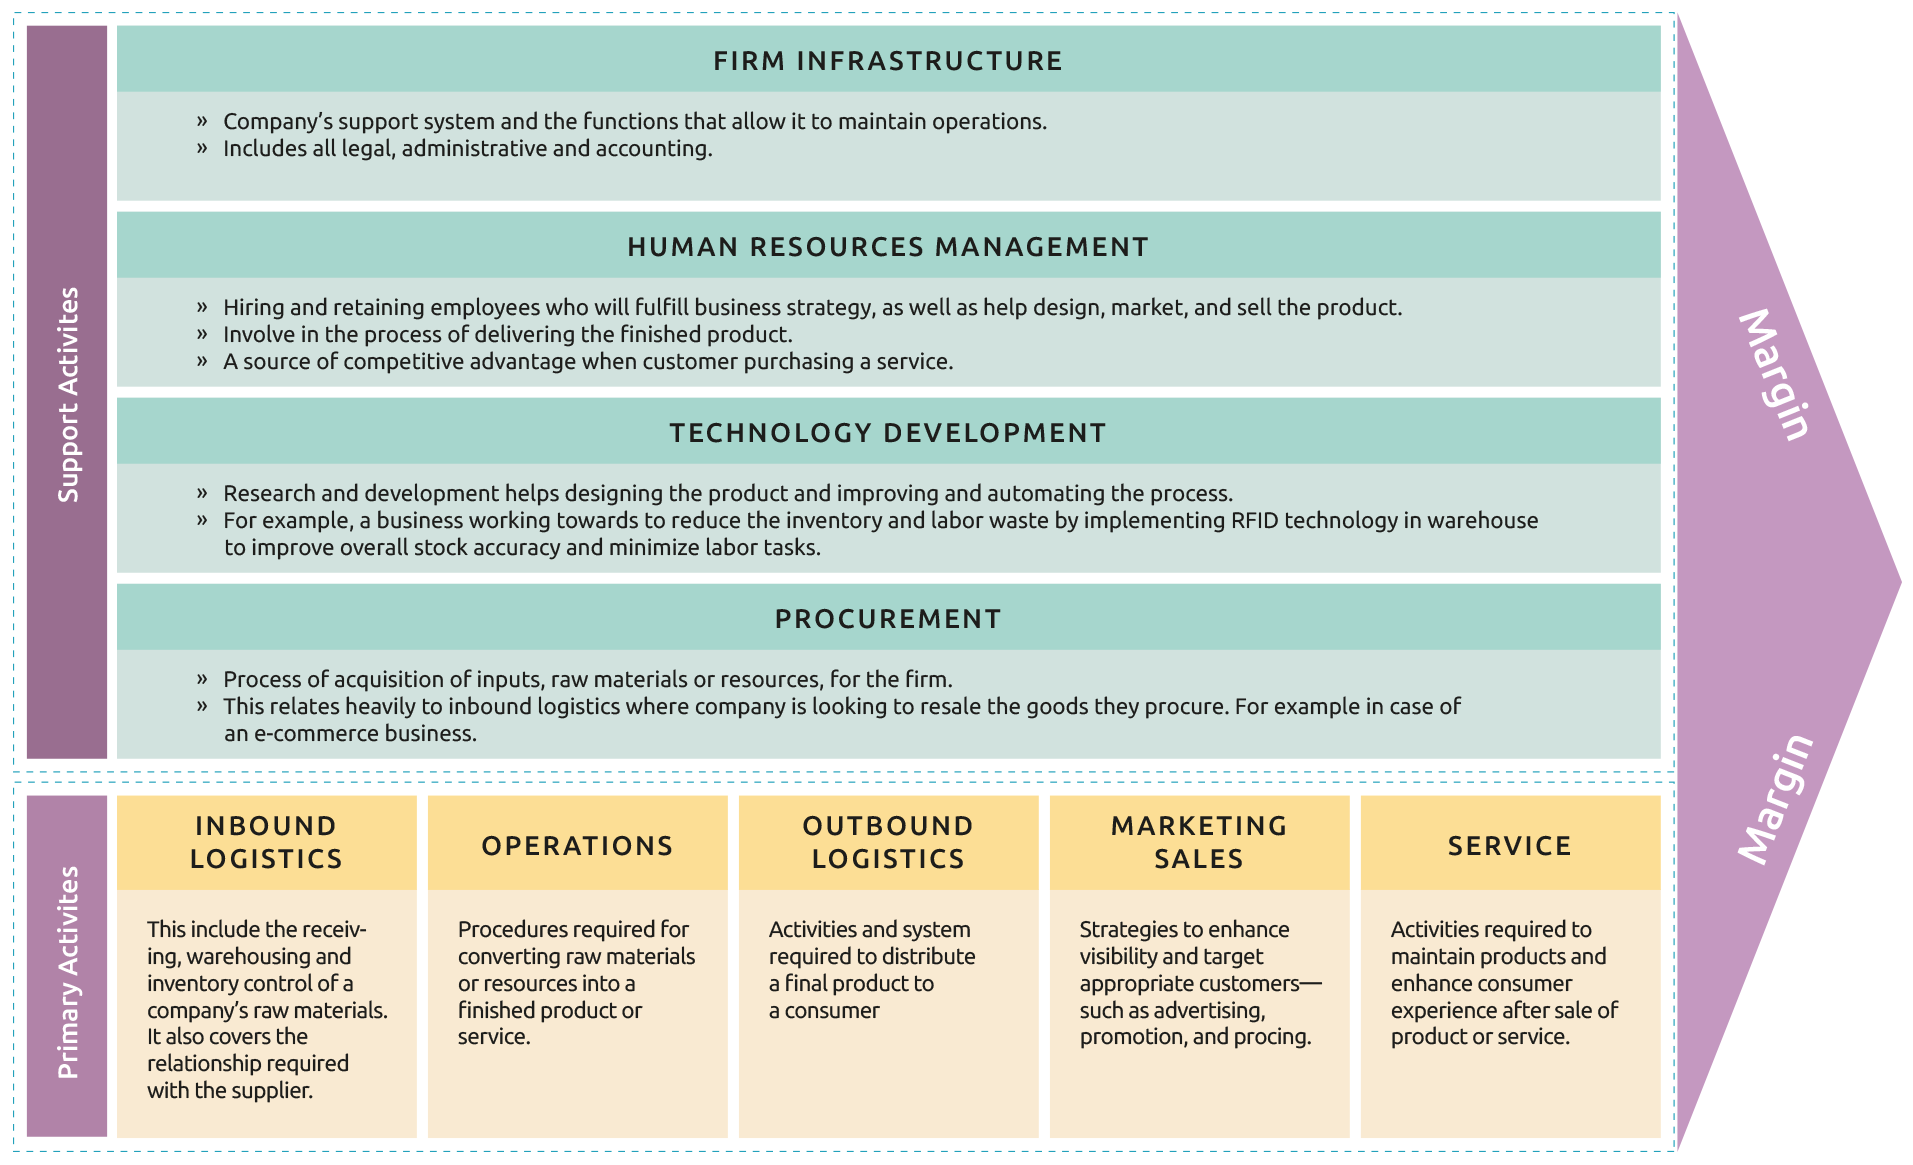
Now, why is this important? Understanding the primary & secondary activities helps to understand the relationships among participants among whom these activities are distributed.
Michael J. Mauboussin in his seminal article "Measuring the moat" has laid this clearly as below :
- Step 1 - Construct an Industry Map
- Step 2 - Understand the nature of economic interactions between the organizations on the map
- Step 3 - Understand how the economic profit is distributed among the participant organizations
Let us explore the above
Constructing Industry Map
An industry map gives a lay of the land of
- Who are the participants (firms, suppliers, customers, regulators etc) in the industry layout.
- Suppliers, who provide the firm with inputs are typically on the left side of the map.
- Customers, the purchasers of goods & services are on the right.
- What are the economic interactions between those participants. We also consider factors such as government regulations, tarffs & labor markets etc.
- The underlying economic & other factors contributing to those interactions &
- How do those activities convert to economic profit & how is is divided amongst the participants
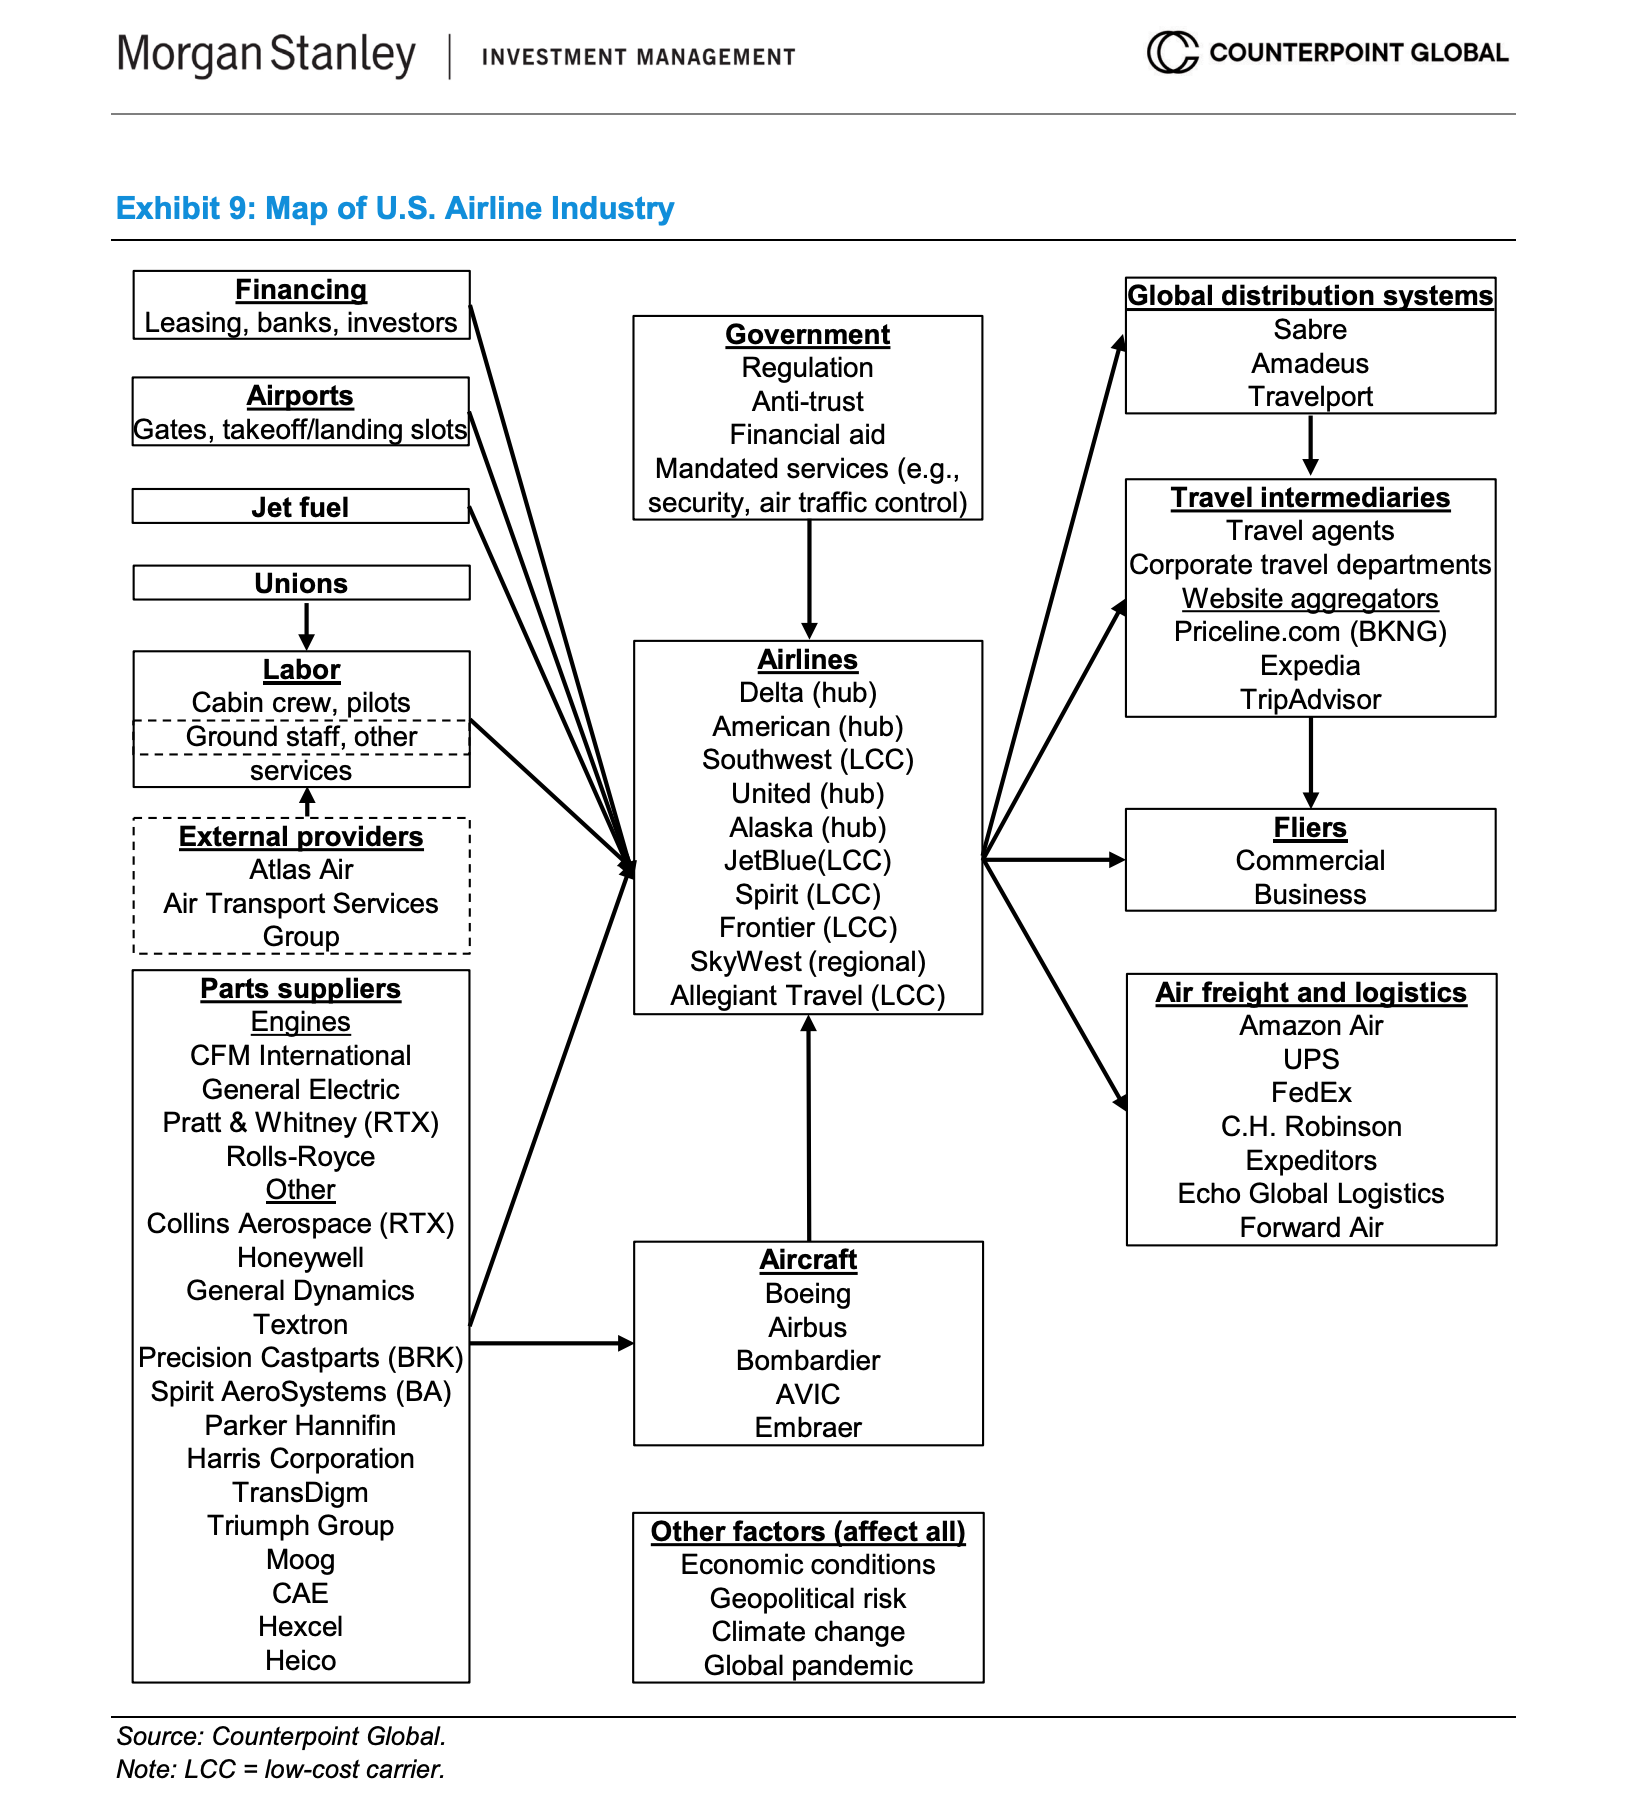
The below visual from his report of the airline industry is given below for better clarity :
Understand Economic Interactions
Once the map is drawn, it is important to understand the economic interactions between the participants in the map. For e.g., in the airline industry mapping above, companies under the Global distribution systems provide software to the airlines for ticketing & other services. These are contractual relationships for SaaS. Purchasing aircraft from Boeing, Airbus etc involves lease agreements.
Why is understanding this important? It shows which players in the airline industry capture the value of services provided to customers for flight services. We will get into numbers when we analyze the airlines industry in a couple of weeks. However, it is more important to get a mental model of the industry before getting into the numbers .
In addition to the economic interactions among the players, it is also important to understand how factors beyond the industry affect industry profitability like overall economic conditions, geopolitical risks, climate change etc. We know how the global pandemic affected the airlines industry severely & the time it took for recovery.
All the above impact industry as well as company profitability.
Distribution of Economic Profits
Once the industry is mapped to understand the structure & the economic interactions understood, the next step is to understand who captures the maximum value in this environment.
The tool used for this purpose is the profit pool analysis. Economic profit is defined as the spread between ROIC (Return on Invested Capital) & WACC (Weighted Average Cost of Capital) times Invested Capital or
Economic Profit = (ROIC - WACC) * Invested Capital
To visualize the above diagramatically, let us take Invested Capital on the X-axis & the spread between ROIC & WACC on the Y-axis.
This way we can interpret the profit pool is :
- The Y-axis shows value creation as a % (width) &
- The X-axis shows how much money is invested (length)
The economic profit equals it's area (length * width)
Visualizing the above :
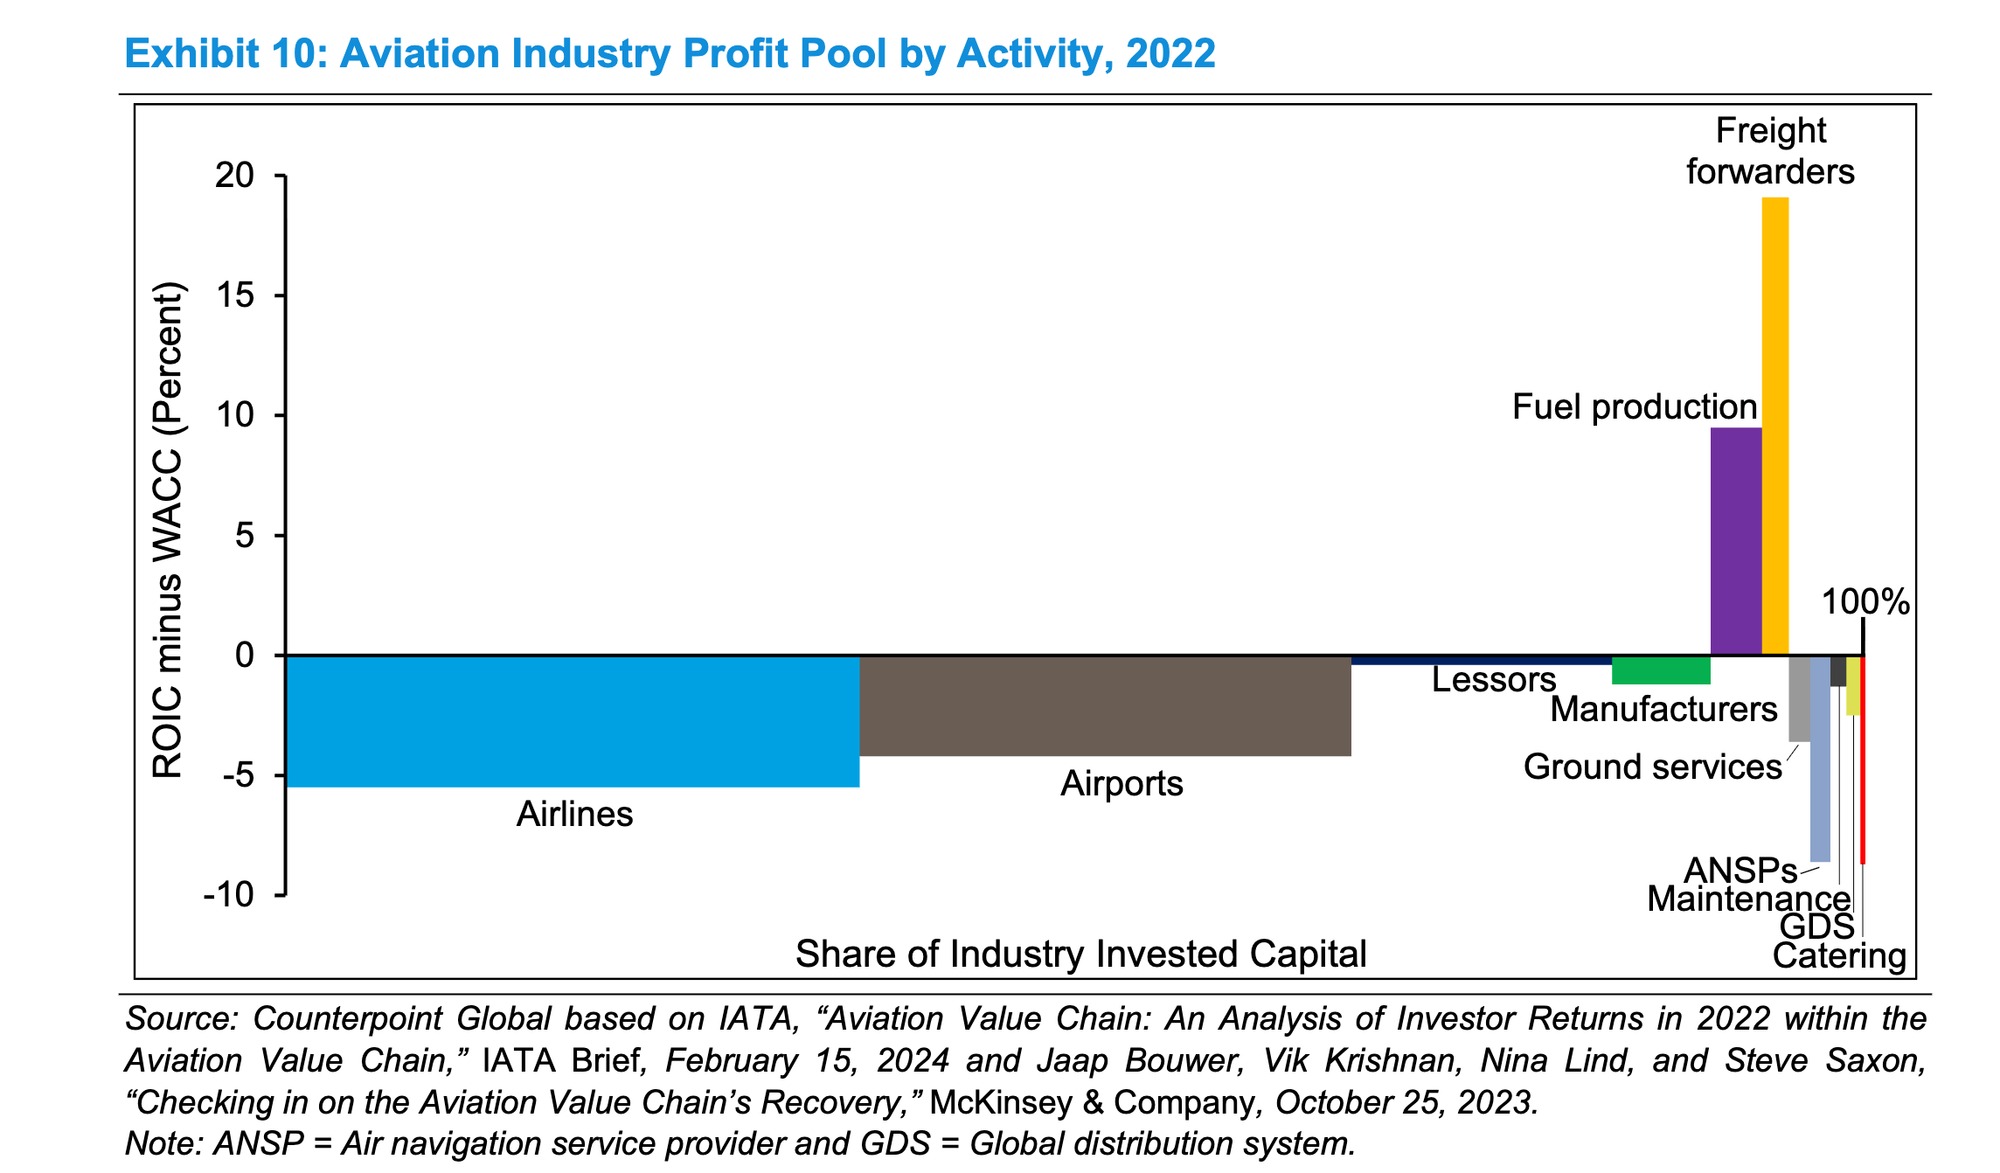
What do you see from that above visual?
Most of the invested capital is in Airlines & Airports but the economic spread on these investments is negative. Fuel production & freight forwarders have positive economic profit but their invested capital is relatively small.
The report recommends :
- It is better to look at results over a business cycle because it reduces the impact of short-term or cyclical factors
- Periodic snapshots can indicate how competitive dynamics change over time which brings us to the next section on mapping the future.
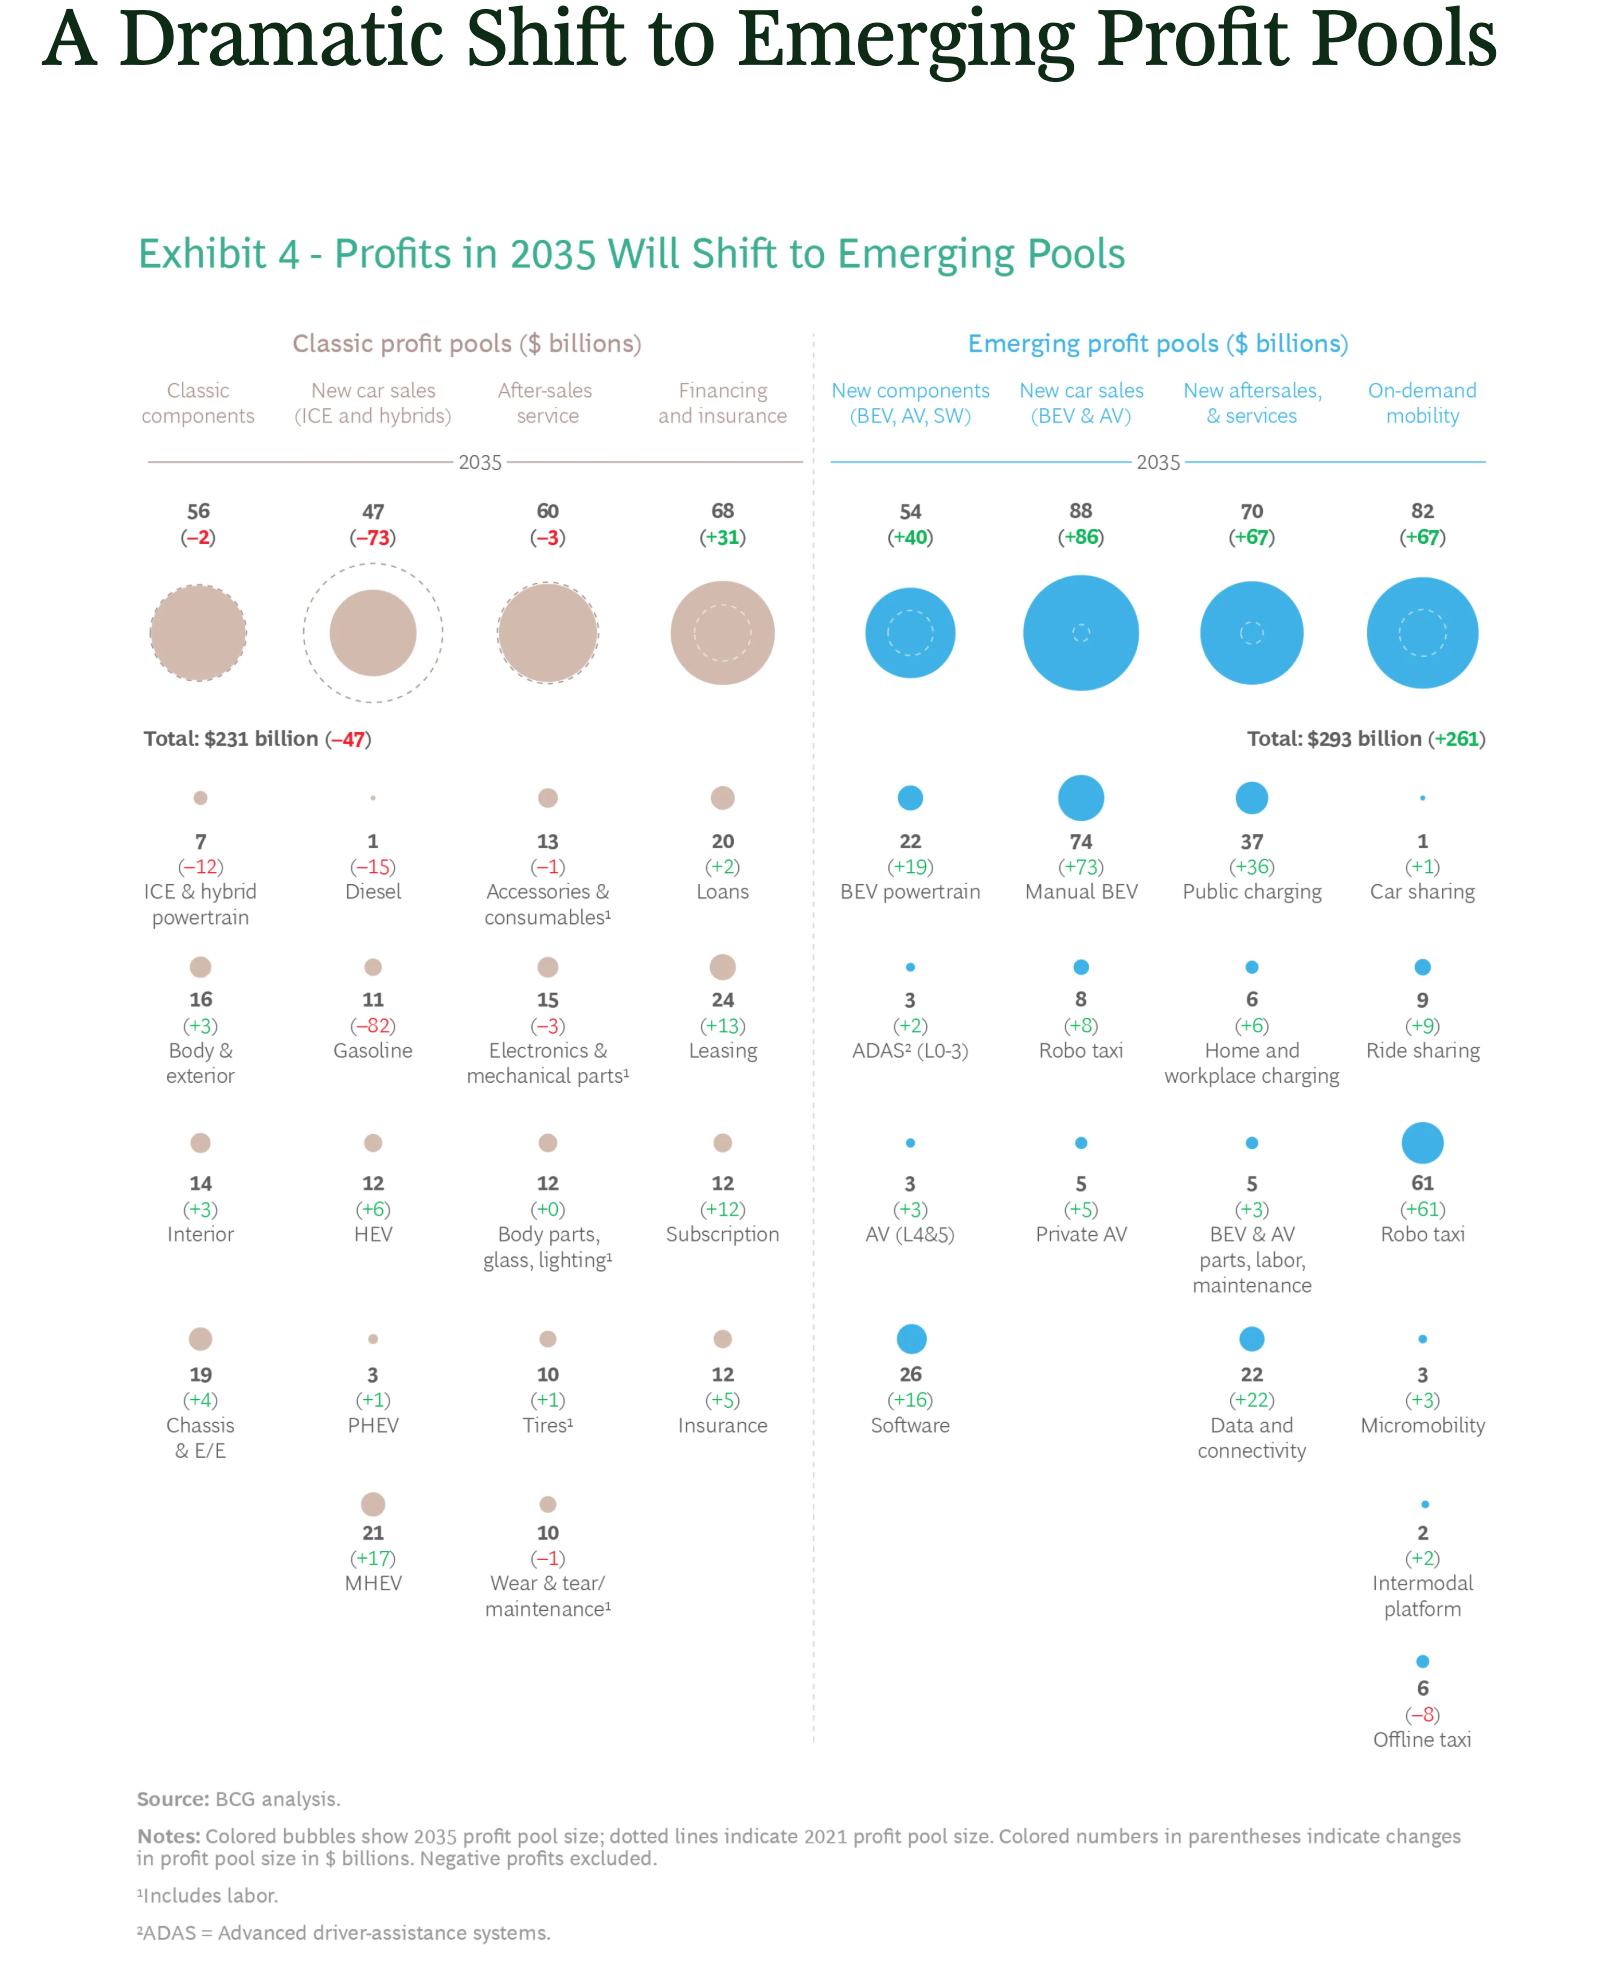
Mapping the Future
Now that we have an idea of how to map & visualize the economic profit being captured by the activities & players within an industry, what next?
Why do I really care to understand how this helps in strategy?
The question to answer here is - What if the map itself is changing through disruption or other economic or geopolitical factors? We can see supply chain disruptions happening right in front of us now due to geopolitical factors.
If that is the case,
- Will the current activities contributing to economic profit exist in the next couple of years or decades or their contribution reduce?
- What are the activities which will contribute to economic profit in the future?
This analysis will show
- how an industry is evolving &
- how the activity mix contributing to economic profit will evolve accordingly.
Below visual from BCG (Boston Consulting Group) is apt :
Next week, we will tie up all the concepts we discussed over the last couple of weeks to map the mental model needed for industry analysis before we deep dive into individual industries.