Strategy Byte Week 79 - From Value to Numbers

Table of Contents
- Value
- Numbers
- Returns vs. Cost
- Company Valuation
- Apple - Strategy to Numbers
Value
When I wrote Week 77 & Week 78 of Strategy Byte on value from the perspective of a customer & that of a firm, I was wondering isn't identifying & tracking the relevant drivers of that value our responsibility as finance?
Now, let us be clear on what responsibilities lies with whom?
The ownership of Strategy lies with the CEO who is responsible for it's creation & driving it across the organization. As I mentioned earlier in one of my posts, the responsibility of tracking revenue & cost drivers along with the variables in the external environment is with finance. Finance has a unique vantage point across the entire organization to see how each variable is performing.
As we discussed in Week 78 of Strategy Byte, from a firm perspective, there are two sides to the value equation :
- Value to Customer - The Product or service should deliver value which the customer is willing to pay for &
- Cost to Firm - Value is not created from nothing. There are inputs, processes run to create the output which delivers value to customers.
The firm must develop (as Roger L Martin says)
- It's capabilities (Or Must Have Capabilities -MHC) &
- Systems / processes (Essential Management Systems)
to continue to deliver value sustainably.
These capabilities & systems either individually or in combination must be unique to the firm which it's competitors will not be able to copy or implement on their own. (The Can't / Won' t Test from Roger L Martin).
The Can't / Won't test means that a competitor can't or won't replicate a firm's strategy choices & therefore eliminate it's distinctiveness (From Roger L. Martin)
That distinctiveness is what drives competitive advantage. What does competitive advantage mean?
Where a company is able to
- Provide differentiated value to customers at similar costs to other competitors or
- Provide same or comparable value to customers at lower costs compared to competitors
through it's uniqueness, then it has competitive advantage.
Now, how do we know whether a strategy is actually working? Sure, there are qualitative factors like customer feedback, higher sales etc. But is qualitative factors enough to understand if a strategy is working or not?
No. Why? Let us see
Numbers

Let us start our journey with two questions :
- How do we translate value into numbers &
- How will we know whether the drivers of value are still working or not?
We need to track one concept - The value provided to customer resulting in higher Willingness to Pay must be higher than cost to provide that value.
But it is simpler said that done. That is because what is an objective number for value? Sales, Gross Profit, Net Profit?
Each number has it's own meaning - Increasing sales mean demand for the goods or services is healthy. Higher Gross or Net Profit margin compared to competitors mean efficient cost management & control - meaning lower or similar costs in face of higher sales
We cannot say value is one number. But, we can say that a company must earn more than what is spends & that value has to be higher than it's competitors.
What does it mean? Let us explore
Returns vs Cost
Michael J Mauboussin & Dan Callahan released two research papers called "Competitive Advantage Period - Neglected Value Driver" & "Measuring the Moat - Assessing the Magnitude & Sustainability of Value Creation".
As per their research, when we say a company must earn more than what it spends, it means
"The goal of a company is to identify & execute a strategy that gives it a competitive advantage that is sustainable. A company's anticipated Value creation is measured by
- how much it's return on invested capital (RoIC) exceeds it's cost of capital as well as
- how long it can maintain a positive spread, a reflection of it's sustainable competitive advantage."
What does each of the above terms mean? As per the papers,
RoIC is defined as net operating profit after taxes (NOPAT) divided by Invested Capital.
Cost of Capital is it's Weighted Average Cost of Capital (WACC)
Invested Capital is the net assets a company needs to generate NOPAT.
RoIC = NOPAT / Invested Capital
Value Creation = RoIC - WACC
In other words, we measure the magnitude of positive spread between Return on Invested Capital (RoIC) & the Weighted Average Cost of Capital (WACC) as well as how long a company can earn that positive spread.
Another important point to note is sustainable value creation is distinct from sustainable competitive advantage - where a company generates as RoIC over WACC that is also higher than that of it's competitors. That is where value creation of a company is reflected.
Company Valuation
Earlier, we saw how value was quantified into spread between RoIC & WACC & it's sustainability along with how much more it earns compared to competitors.
The net returns earned by a company ultimately earns is meaningful only if it converts to cash which can be invested or spent. So, the value which the company generates for customers & is captured by the company ultimately results in cash flows over a number of years depending on how long the company sustains it's competitive advantage.
This ultimately translates to company value or market capitalization where we quantify the cash flows a company will generate over a given period, when they may be received & discounting those cash flows at a discount rate to arrive at what the company is worth. (We will get into this in subsequent posts)
Apple - Strategy to Numbers

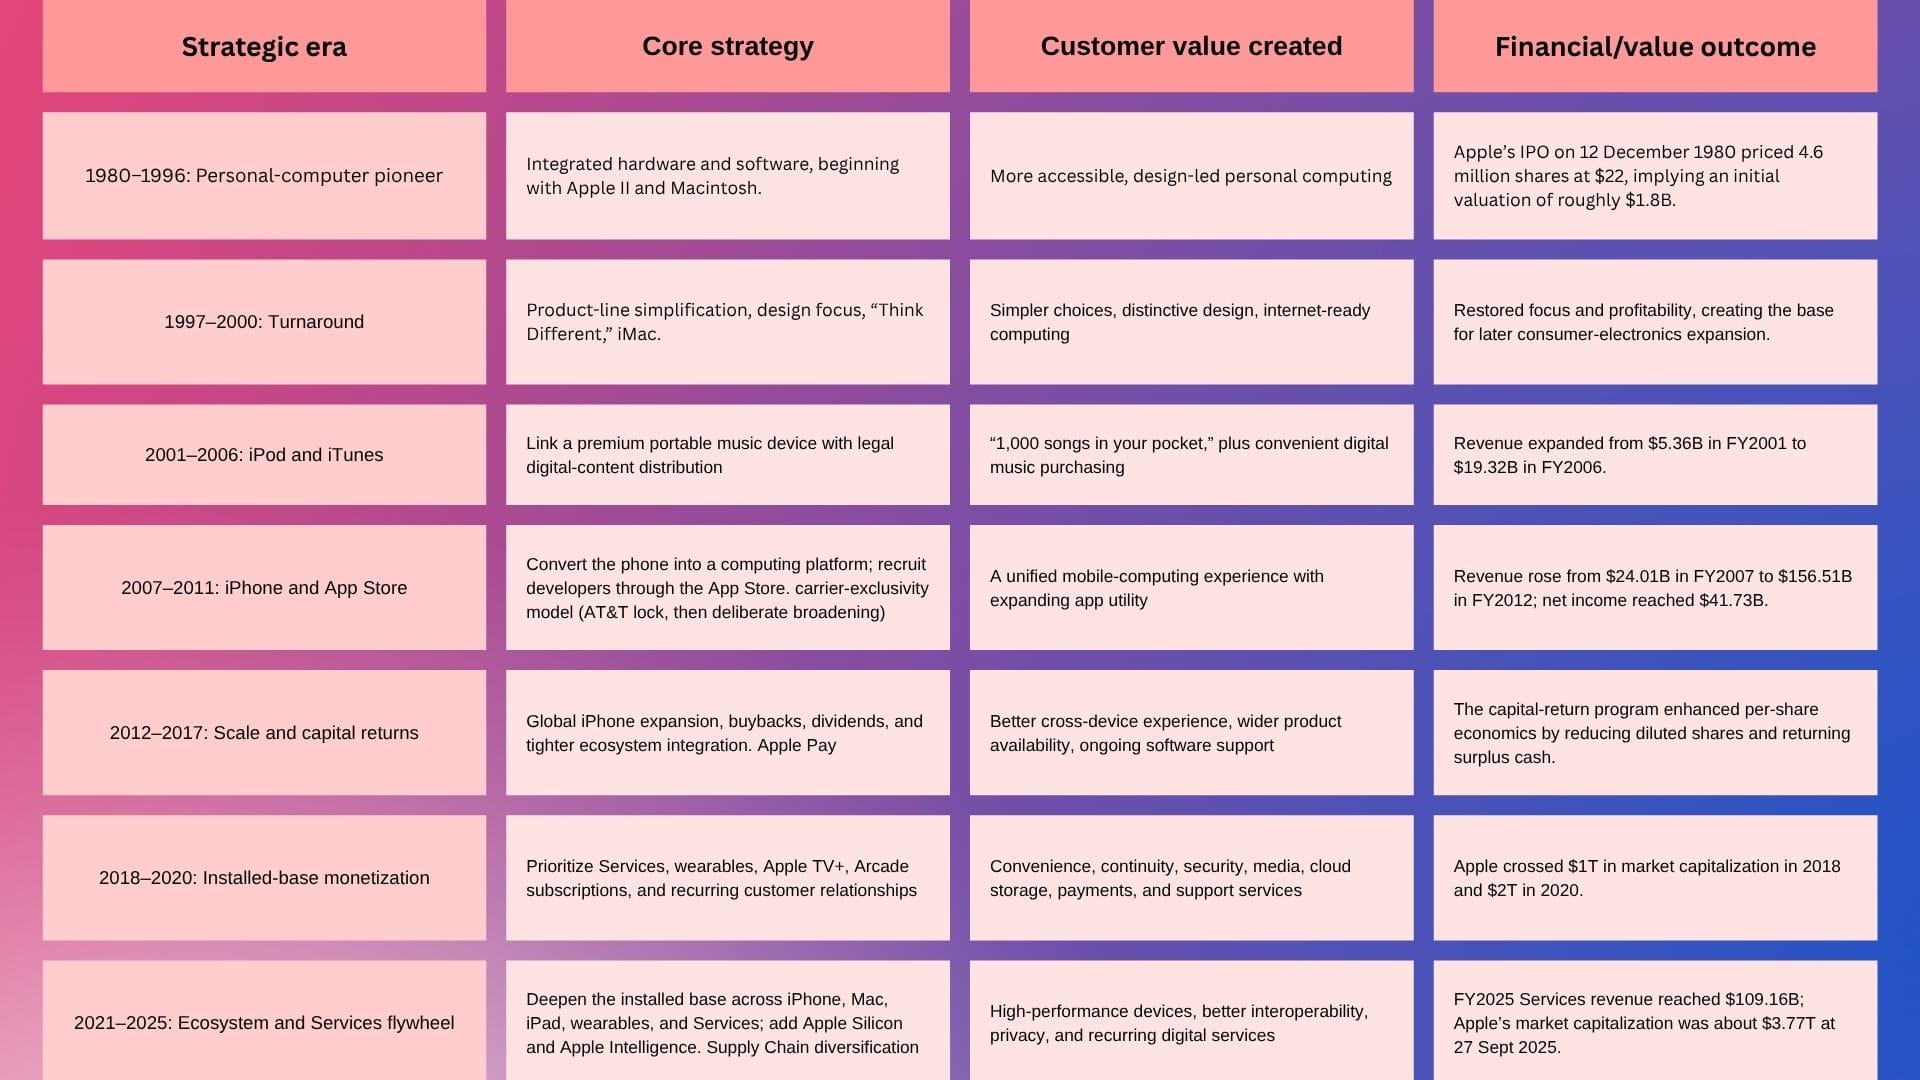
I love Apple products & I may be biased towards Apple but there is no denying that the company is the embodiment of value creation through differentiation which is reflected in the fact that it is the first US company to cross USD 1 Trillion in market capitalization in 2018 & USD 2 Trillion in 2020.
But there were multiple pivots & strategic choices which Apple took over the years to add value to customers which translated to revenues & it's trillion dollar market capitalization. The common thread of it's strategy choice across the periods is premium positioning, pricing & direct distribution
Below table (From Perplexity Research) where we link Apple's journey from 1980s, the strategies at various points in time, the customer value created & the financial outcome in terms of market capitalization & revenue.